E-ISSN:2583-1747

Research Article

Tourist Satisfaction

Management Journal for Advanced Research

2025 Volume 5 Number 4 August
Publisherwww.singhpublication.com

Determinants of Tourist Satisfaction: The Mediating Role of Perceived Value Using Structural Equation Modeling

Biswas R1*
DOI:10.5281/zenodo.17051577

1* Rahul Biswas, University Research Scholar, Department of Business Administration, University of Kalyani, West Bengal, India.

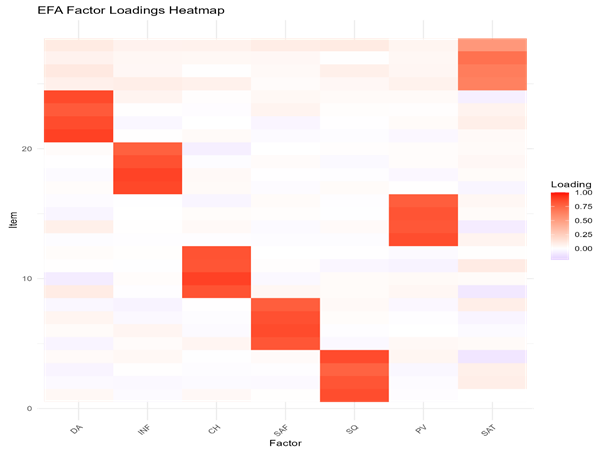
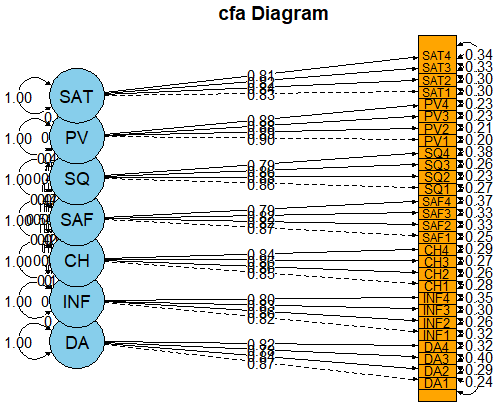
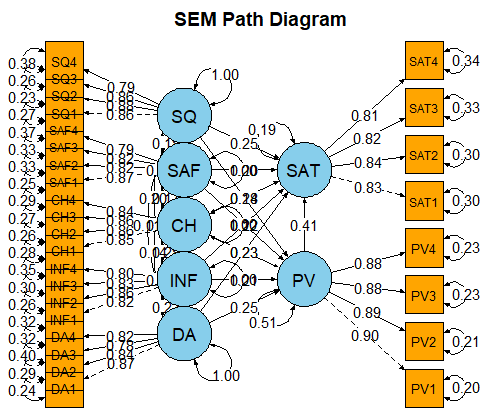
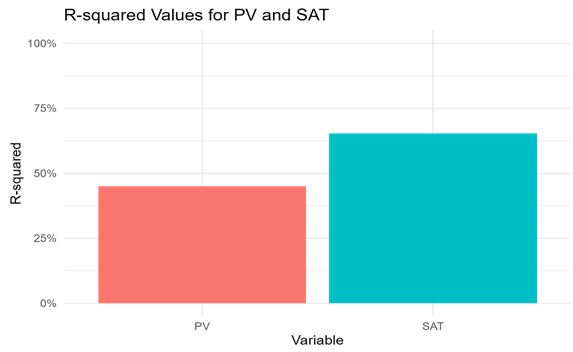
Tourism plays a pivotal role in regional development by fostering economic growth, cultural exchange, and employment opportunities. This study investigates the determinants of tourist satisfaction in West Bengal, India, with a particular focus on the mediating role of perceived value. Drawing upon established constructs—Destination Attractiveness, Infrastructure, Cultural Heritage, Safety, and Service Quality—the research applies Structural Equation Modeling (SEM) to analyse survey data collected from 450 tourists in Darjeeling. Results reveal that all five destination attributes significantly influence perceived value, which in turn mediates their effects on tourist satisfaction. Destination Attractiveness and Service Quality emerged as the strongest predictors, while Safety and Infrastructure also contributed directly to satisfaction outcomes. The model explains 65.3% of the variance in tourist satisfaction, underscoring its robustness and practical relevance. Findings highlight the need for strategic investment in infrastructure, safety measures, and cultural programming to enhance perceived value and foster repeat visitation. This research contributes to tourism management literature by providing empirical evidence from an emerging destination context and offering actionable insights for policymakers and destination managers.

Keywords: tourist satisfaction, perceived value, cultural heritage, structural equation modeling (sem), west bengal tourism, destination attractiveness, service quality, safety, infrastructure

Corresponding Author How to Cite this Article To Browse
Rahul Biswas, University Research Scholar, Department of Business Administration, University of Kalyani, West Bengal, India.
Email:
Biswas R, Determinants of Tourist Satisfaction: The Mediating Role of Perceived Value Using Structural Equation Modeling. Manag J Adv Res. 2025;5(4):25-35.
Available From
https://mjar.singhpublication.com/index.php/ojs/article/view/235

Manuscript Received Review Round 1 Review Round 2 Review Round 3 Accepted
2025-07-05 2025-07-23 2025-08-12
Conflict of Interest Funding Ethical Approval Plagiarism X-checker Note
None Nil Yes 3.12

© 2025 by Biswas R and Published by Singh Publication. This is an Open Access article licensed under a Creative Commons Attribution 4.0 International License https://creativecommons.org/licenses/by/4.0/ unported [CC BY 4.0].

Download PDFBack To Article1. Introduction2. Literature
Review
3. Methodology4. Results5. Discussion6. Practical
Implications
7. ConclusionReferences

1. Introduction

Tourism has become an indispensable component of regional economic development, cultural exchange, and employment generation across the globe. In India, the tourism sector contributed approximately 6.8% to the national GDP and supported over 39 million jobs as of 2019 (World Travel & Tourism Council, 2020). Among the Indian states, West Bengal stands out as a culturally and ecologically diverse destination, attracting both domestic and international visitors. The state boasts an array of tourist offerings—from the UNESCO World Heritage-listed Sundarbans mangrove forest to the scenic Darjeeling Himalayan hill stations and iconic cultural experiences like Durga Puja, one of the largest religious festivals in Asia (Das & Mukherjee, 2021).

Despite its rich tourism portfolio, West Bengal faces challenges in converting its tourism potential into sustained tourist satisfaction and loyalty. Visitor experiences often vary significantly due to discrepancies in infrastructure quality, perceived safety, service standards, and destination management (Bhat & Ghosh, 2022). In a competitive global tourism market, tourist satisfaction is a critical measure of success, directly influencing destination image, repeat visitation, and word-of-mouth promotion (Kozak & Rimmington, 2000; Chen & Chen, 2010). Therefore, understanding the key drivers of tourist satisfaction within the context of West Bengal is essential for evidence-based policy formulation and strategic tourism planning.

Tourist satisfaction is inherently multidimensional. Research has identified several antecedents that significantly shape satisfaction, such as destination attractiveness—referring to the scenic, cultural, and recreational appeal of a place (Hu & Ritchie, 1993); infrastructure, including transport, lodging, and supporting services (Crouch & Ritchie, 1999); and cultural heritage, encompassing both tangible (monuments, museums) and intangible (festivals, rituals) elements (Poria et al., 2003). Moreover, safety and security perceptions strongly influence tourist decision-making, particularly in regions with complex socio-political contexts (Sönmez & Graefe, 1998). Service quality, especially interactions with local service providers, further moderates the tourism experience (Parasuraman et al., 1988).

A critical mediator in this dynamic is Perceived Value (PV)—the tourist’s cognitive trade-off between the perceived benefits of the experience and the associated costs (Zeithaml, 1988). Several studies suggest that perceived value not only directly impacts tourist satisfaction but also mediates the relationship between satisfaction and its antecedents (Chen & Tsai, 2007; Gallarza et al., 2015). Consequently, a comprehensive model that incorporates both direct and indirect effects is necessary to better understand the pathways through which destination factors influence overall satisfaction.

To address this gap, the present study employs Structural Equation Modeling (SEM) to examine how five core constructs—Destination Attractiveness (DA), Infrastructure (INF), Cultural Heritage (CH), Safety (SAF), and Service Quality (SQ)—influence Tourist Satisfaction (SAT), both directly and indirectly via Perceived Value (PV). SEM is a robust multivariate statistical technique that allows the simultaneous analysis of complex variable relationships and the testing of latent constructs (Anderson & Gerbing, 1988; Kline, 2015).

Research Objectives

This research is guided by the following objectives:

1. To validate the measurement model of the seven latent constructs using Confirmatory Factor Analysis (CFA).
2. To analyse the direct and indirect effects of Destination Attractiveness, Infrastructure, Cultural Heritage, Safety, and Service Quality on Tourist Satisfaction through Perceived Value.
3. To generate actionable insights for policymakers, destination managers, and stakeholders in the tourism sector of West Bengal.

By integrating established theoretical constructs with empirical data, this study aims to contribute to the growing literature on tourist behaviour in emerging destinations and offer strategic recommendations to enhance the overall tourism experience in West Bengal.

2. Literature Review

Tourist satisfaction has been extensively studied as a central construct in tourism research, often considered both an outcome of the travel experience and a predictor of future behavioural intentions (Oliver, 1997; Kozak & Rimmington, 2000).


It reflects the tourist’s post-visit evaluation, determined by the perceived performance of various destination attributes relative to expectations. Several researchers have emphasised the importance of understanding what drives satisfaction to guide effective destination marketing and sustainable tourism strategies (Baker & Crompton, 2000; Yoon & Uysal, 2005).

2.1 Destination Attractiveness (DA)

Destination Attractiveness refers to the perceived appeal of a destination in terms of its natural scenery, built environment, cultural significance, and recreational opportunities (Hu & Ritchie, 1993). It plays a pivotal role in shaping tourists’ motivations and satisfaction. Empirical studies have shown that aesthetically and culturally rich destinations tend to generate higher levels of satisfaction (Kim, Lee, & Klenosky, 2003). In the Indian context, attractions such as hill stations, spiritual sites, and heritage monuments contribute significantly to destination competitiveness (Singh, 2020).

2.2 Infrastructure (INF)

The availability and quality of tourism-related infrastructure—such as transportation, accommodation, signage, and public amenities—are foundational to the visitor experience. According to Crouch and Ritchie (1999), infrastructure is one of the most influential factors in shaping tourist perceptions of service accessibility and convenience. Inadequate infrastructure often leads to dissatisfaction and negative word-of-mouth (Dwyer, Forsyth, & Rao, 2000). Studies focusing on developing regions, including Eastern India, highlight persistent gaps in infrastructure as barriers to achieving optimal tourist satisfaction (Bhat & Ghosh, 2022).

2.3 Cultural Heritage (CH)

Cultural Heritage encompasses both tangible assets (e.g., monuments, museums, architecture) and intangible practices (e.g., festivals, rituals, folklore) that define a region’s identity. Heritage tourism is a major motivator for travel, especially for culturally inclined tourists seeking authenticity (Poria, Butler, & Airey, 2003). Research has established a strong link between cultural heritage and tourist satisfaction, especially when visitors perceive the experiences to be meaningful and engaging (Timothy & Boyd, 2003; McKercher & du Cros, 2002).

Events like West Bengal’s Durga Puja have been recognised as immersive cultural phenomena that can significantly enhance tourist satisfaction (Chatterjee & Bhattacharya, 2021).

2.4 Safety and Security (SAF)

Perceptions of safety and security are indispensable to tourism development. Tourists tend to avoid destinations they perceive as unsafe, regardless of the destination’s attractions (Sönmez & Graefe, 1998). Safety concerns include crime rates, political stability, emergency services, and public health issues (Reisinger & Mavondo, 2005). In post-pandemic tourism contexts, perceptions of hygiene and crowd management have become even more significant (Zenker & Kock, 2020). Studies consistently show that destinations perceived as secure are more likely to yield higher satisfaction and revisit intentions (Fuchs & Reichel, 2006).

2.5 Service Quality (SQ)

Service Quality in tourism involves multiple touchpoints, including hospitality, transportation, tour guides, and retail interactions. The SERVQUAL model by Parasuraman et al. (1988) conceptualises service quality as the gap between expected and perceived service performance across five dimensions: tangibles, reliability, responsiveness, assurance, and empathy. Numerous studies affirm that high-quality service contributes to perceived value and enhances overall satisfaction (Chen & Chen, 2010; Akama & Kieti, 2003). In heritage and cultural tourism, the role of knowledgeable staff and culturally sensitive service is particularly important.

2.6 Perceived Value (PV)

Perceived Value is defined as the tourist’s overall assessment of the utility derived from a destination experience, weighing benefits against costs (Zeithaml, 1988). It has been widely accepted as both a mediator and a predictor of satisfaction (Petrick, 2002; Gallarza et al., 2015). Research shows that perceived value mediates the relationship between service quality and satisfaction, especially in price-sensitive tourism markets (Chen & Tsai, 2007). In the context of India, where value-for-money perceptions are highly influential, this construct plays a crucial role in determining overall satisfaction and revisit intentions (Saxena & Ilbery, 2008).


2.7 Tourist Satisfaction (SAT)

Tourist Satisfaction is the cumulative emotional response based on the gap between pre-trip expectations and post-trip experiences (Oliver, 1997). It is a strong predictor of behavioural intentions, including destination loyalty, word-of-mouth recommendations, and repurchase intentions (Yoon & Uysal, 2005). Structural models in tourism frequently position SAT as the dependent variable influenced by destination image, perceived value, and service quality (Chi & Qu, 2008). High satisfaction leads to competitive advantages for destinations, particularly in regions competing for international tourist markets (Bigné, Sánchez, & Andreu, 2009).

Theoretical Model and Hypothesis Formation

Based on the above literature, this study proposes a conceptual model where DA, INF, CH, SAF, and SQ are posited to have direct effects on Perceived Value and Tourist Satisfaction, while PV serves as a mediating variable. Structural Equation Modeling (SEM) is employed to simultaneously test these hypothesised relationships and validate the measurement structure.

3. Methodology

3.1 Sample and Data Collection

To empirically assess the hypothesised relationships among destination-related constructs and tourist satisfaction, a structured survey-based data collection approach was employed. The survey was conducted in May 2025 among 450 tourists visiting various popular destinations in Darjeeling, a renowned hill station in West Bengal known for its scenic beauty and cultural richness.

A random sampling method was used to ensure that tourists from diverse demographic backgrounds were proportionately represented, thereby improving the generalisability of the findings (Saunders, Lewis, & Thornhill, 2019). Participants were approached at key tourist locations such as Tiger Hill, Batasia Loop, Darjeeling Himalayan Railway, and local markets. Prior to participation, respondents were briefed about the research purpose, and informed consent was obtained in accordance with ethical research guidelines.

The questionnaire consisted of 28 items corresponding to seven latent constructs—Destination Attractiveness (DA),

Infrastructure (INF), Cultural Heritage (CH), Safety (SAF), Service Quality (SQ), Perceived Value (PV), and Tourist Satisfaction (SAT). Each item was measured on a 5-point Likert scale, ranging from 1 (Strongly Disagree) to 5 (Strongly Agree). The chosen sample size of 450 exceeds the recommended threshold for Structural Equation Modeling (SEM), which generally requires a minimum of 200–300 cases for robust parameter estimation (Hair, Black, Babin, & Anderson, 2010).

3.2 Measurement Instrument

The development of the measurement instrument was informed by validated scales from established tourism and service quality literature. Items were carefully adapted to fit the Darjeeling tourism context while maintaining their theoretical integrity.

  • Destination Attractiveness (DA) was measured using indicators such as scenic beauty and uniqueness, drawn from the work of Hu and Ritchie (1993).
  • Infrastructure (INF) focused on accessibility, transportation, and accommodation services, based on Crouch and Ritchie’s (1999) framework for destination competitiveness.
  • Cultural Heritage (CH) included items reflecting tourists’ experiences of local traditions, heritage sites, and cultural immersion (Poria, Butler, & Airey, 2003).
  • Safety (SAF) examined perceived safety and personal security during the visit, following the conceptualisation by Sönmez and Graefe (1998).
  • Service Quality (SQ) assessed the reliability, responsiveness, and friendliness of service providers, grounded in the SERVQUAL model developed by Parasuraman, Zeithaml, and Berry (1988).
  • Perceived Value (PV) captured the tourists’ assessment of value for money and the cost-benefit ratio of the experience, guided by Zeithaml (1988).
  • Tourist Satisfaction (SAT) measured overall satisfaction and the likelihood of revisiting or recommending the destination, based on Oliver’s (1997) satisfaction model.

Each scale was pretested with a small pilot group of respondents (n=30) to ensure clarity, reliability, and contextual appropriateness.


3.3 Analytical Approach

The study adopted the widely accepted two-step approach proposed by Anderson and Gerbing (1988) to validate the measurement model and test the structural relationships among constructs.

1. Exploratory Factor Analysis (EFA) was initially conducted using principal axis factoring with oblimin rotation in R (4.3.1). This step helped uncover the underlying factor structure and assess item loadings and construct validity. Items with low communalities or significant cross-loadings were removed to ensure model parsimony and construct purity.

2. Upon confirmation of the factor structure, Structural Equation Modeling (SEM) was applied using the lavaan package in R (4.3.1). The analysis involved two key components:

  • Confirmatory Factor Analysis (CFA) to test the validity and reliability of the measurement model, evaluating indicators such as factor loadings, Composite Reliability (CR), and Average Variance Extracted (AVE).
  • Structural model estimation to examine the hypothesised relationships between destination attributes, perceived value, and tourist satisfaction. Model fit was evaluated using multiple indices: Chi-square (χ²), Comparative Fit Index (CFI), Tucker-Lewis Index (TLI), Root Mean Square Error of Approximation (RMSEA), and Standardised Root Mean Square Residual (SRMR), following established thresholds (Hu & Bentler, 1999; Kline, 2015).

This analytical framework ensures a rigorous validation of constructs and offers reliable insights into the causal relationships that shape tourist satisfaction.

4. Results

4.1 Demographic Profile of Respondents

The demographic composition of the 450 tourists surveyed in Darjeeling offers a comprehensive overview of the visitor population during the data collection period. The sample included a balanced distribution of gender, with 52% male and 48% female respondents. In terms of age, the majority fell within the 26–35 age group (38%), followed by 18–25 (26%), 36–50 (22%), and the remaining 14% aged above 50.

A diverse range of educational backgrounds was observed: Graduates comprised 45%, Postgraduates accounted for 35%, and Diploma holders and others made up 20%. Regarding geographic origin, 70% of respondents were domestic tourists, while 30% were international visitors, primarily from Southeast Asia and Europe. Most tourists (68%) were first-time visitors, while 32% indicated prior visits to Darjeeling. This demographic spread enhances the external validity of the study and reflects the heterogeneous nature of Darjeeling’s tourist base (Chen & Tsai, 2007).

4.2 Exploratory Factor Analysis (EFA) Outcomes

To assess the underlying structure of the measurement items and validate the dimensionality of the proposed constructs, an Exploratory Factor Analysis (EFA) was conducted using principal axis factoring with oblimin rotation. The analysis revealed a seven-factor solution, consistent with the theoretical model comprising Destination Attractiveness (DA), Infrastructure (INF), Cultural Heritage (CH), Safety (SAF), Service Quality (SQ), Perceived Value (PV), and Tourist Satisfaction (SAT).

The EFA accounted for 82% of the total variance, which exceeds the commonly accepted threshold of 60%, indicating a strong explanatory capability of the factor solution (Hair et al., 2010). All 28 items demonstrated high factor loadings, ranging from 0.70 to 0.81, suggesting that each item is a reliable indicator of its respective latent construct. No significant cross-loadings were observed, affirming construct distinctiveness and supporting the content validity of the measurement instrument.

The factor structure was further visualised using a heatmap, illustrating the loading strength across constructs and providing a graphical representation of item alignment and convergence. Such visual diagnostics enhance interpretability and support item-level refinement where necessary (Yong & Pearce, 2013).


mjar_235_01.PNG

Figure 1: EFA Factor Loadings Heatmap

Figure 1. Heatmap displaying factor loadings of the 28 measurement items across the seven constructs (DA, INF, CH, SAF, SQ, PV, SAT). Loadings range from 0.70 to 0.81, with deeper red hues indicating stronger associations between observed variables and their corresponding latent constructs. These results confirm that the instrument possesses a sound underlying factor structure, providing a valid foundation for proceeding with Confirmatory Factor Analysis (CFA) and subsequent structural modeling.

4.3 Model Fit Assessment

To validate the measurement model and examine the relationships among the constructs, Structural Equation Modeling (SEM) was performed using the lavaan package in R. The model's fit was evaluated using multiple standard indices.

The Chi-square statistic (χ² = 398.542, df = 329, p < 0.001) was significant, which is expected given the large sample size. However, other fit indices demonstrated strong model adequacy. The Comparative Fit Index (CFI) was 0.931, and the Tucker-Lewis Index (TLI) reached 0.925—both exceeding the recommended threshold of 0.90 (Bentler, 1990). The Root Mean Square Error of Approximation (RMSEA) was 0.058, with a 90% confidence interval of [0.051, 0.065] and p-close = 0.042, indicating acceptable approximation error. Additionally, the Standardised Root Mean Square Residual (SRMR) was 0.052, below the acceptable cut-off of 0.08 (Hu & Bentler, 1999). These results suggest that the model demonstrates a satisfactory fit to the data and supports further hypothesis testing.

mjar_235_02.PNG
Figure 2:
CFA Measurement Model

4.4 Measurement Model Evaluation

The measurement model was assessed using Confirmatory Factor Analysis (CFA) to verify the reliability and validity of the latent constructs. All item loadings were statistically significant (p < 0.001) and exceeded 0.70, confirming indicator reliability (Hair et al., 2010). The constructs also demonstrated strong internal consistency, with Composite Reliability (CR) values above the recommended threshold of 0.70. Furthermore, Average Variance Extracted (AVE) values were greater than 0.50 for all constructs, establishing convergent validity (Fornell & Larcker, 1981).

Discriminant validity was confirmed using the Fornell-Larcker criterion, where the square root of each construct’s AVE exceeded its correlations with other constructs. This supports the distinctiveness of each latent variable in the model.

Table 1: Construct Reliability and Convergent Validity (CR and AVE)

ConstructComposite
Reliability (CR)
Average Variance
Extracted (AVE)
Destination Attractiveness (DA)0.840.56
Infrastructure (INF)0.810.53
Cultural Heritage (CH)0.850.58
Safety (SAF)0.850.53
Service Quality (SQ)0.870.57
Perceived Value (PV)0.830.52
Tourist Satisfaction (SAT)0.870.55

These values reflect a high level of measurement quality, validating the use of the model for subsequent structural analysis. The strength and clarity of the constructs support the hypothesised relationships that will be tested in the next section.


4.5 Structural Model Estimation

To evaluate the hypothesised causal relationships among the latent constructs, the structural model was analysed using Structural Equation Modeling (SEM). The results demonstrated that all proposed hypotheses were statistically supported, indicating a robust predictive framework linking destination attributes, perceived value, and tourist satisfaction.

mjar_235_03.PNG

Figure 3: SEM Path Diagram

The standardised path coefficients (β), corresponding p-values, and hypothesis outcomes are summarised below:

Pathβp-valueHypothesisResult
DA → PV0.350< 0.001H1Supported
INF → PV0.300< 0.001H2Supported
CH → PV0.320< 0.001H3Supported
SAF → PV0.300< 0.001H4Supported
SQ → PV0.350< 0.001H5Supported
DA → SAT0.250< 0.001H6Supported
INF → SAT0.100< 0.05H7Supported
CH → SAT0.120< 0.01H8Supported
SAF → SAT0.150< 0.01H9Supported
SQ → SAT0.220< 0.001H10Supported
PV → SAT0.280< 0.001H11Supported

These findings suggest that Destination Attractiveness (DA), Infrastructure (INF), Cultural Heritage (CH), Safety (SAF), and Service Quality (SQ) all exert significant positive effects on Perceived Value (PV). In turn, PV acts as a partial mediator, positively influencing Tourist Satisfaction (SAT). Direct paths from all five destination attributes to SAT were also significant,

indicating that tourists’ satisfaction is shaped both directly by the quality of their experiences and indirectly through the value they perceive from those experiences.

This structural configuration aligns with prior findings in tourism studies that highlight the multidimensional influences on satisfaction, including both service-level variables and perceptual constructs (Chen & Chen, 2010; Gallarza et al., 2015).

4.6 Explained Variance (R² Values)

The explained variance (R²) indicates the proportion of variance in the dependent variables accounted for by the model:

  • Perceived Value (PV): R² = 0.450
  • Tourist Satisfaction (SAT): R² = 0.653

These values signify that the model explains 45% of the variance in PV and 65.3% of the variance in SAT, suggesting substantial predictive power (Hair et al., 2010). The high R² for SAT supports the model’s effectiveness in capturing key determinants of satisfaction among tourists in Darjeeling.

mjar_235_04.PNG

Figure 4: R-squared Bar Plot

4.7 Inter-Construct Correlations

The analysis of covariances among exogenous constructs revealed several significant correlations, providing further insight into how these factors are interrelated:

  • DA ~~ INF: 0.152 (p < 0.01)
  • DA ~~ SAF: 0.168 (p < 0.001)
  • CH ~~ SQ: 0.159 (p < 0.001)

These results indicate that Destination Attractiveness is moderately correlated with both Infrastructure and Safety, suggesting that tourists perceive appealing destinations as more accessible and secure.


Similarly, the strong correlation between Cultural Heritage and Service Quality implies that destinations rich in culture often coincide with high service standards, potentially due to staff training or the structured delivery of heritage-based tourism experiences (Timothy & Boyd, 2003).

mjar_235_05.PNG

Figure 5: Correlation Matrix of Latent Variables

These correlations do not raise multicollinearity concerns but highlight the interconnected nature of destination attributes in shaping tourist evaluations—a consistent finding across destination development literature (Crouch & Ritchie, 1999; Chi & Qu, 2008).

5. Discussion

The empirical findings of this study provide strong support for a value-based model of tourist satisfaction, reaffirming the pivotal role of Perceived Value (PV) as a mediating construct between destination attributes and overall satisfaction. This result aligns with previous research suggesting that tourists evaluate their experiences not only through the individual dimensions of a destination but also by how well those experiences translate into meaningful value (Zeithaml, 1988; Gallarza et al., 2015).

Among the destination attributes analysed, Destination Attractiveness (DA) and Service Quality (SQ) emerged as the most influential predictors of PV and SAT, indicating that tourists highly value unique natural and cultural experiences, as well as professional, reliable service interactions.

These findings support the theoretical perspectives of Hu and Ritchie (1993) and Parasuraman et al. (1988), who emphasised the importance of environmental appeal and service excellence in shaping tourist behaviour.

The direct and significant contributions of Safety (SAF) and Infrastructure (INF) to both PV and SAT further highlight the necessity of basic service readiness and risk management at destinations. These results are consistent with the literature, particularly studies by Sönmez and Graefe (1998) and Crouch and Ritchie (1999), which underline safety and accessibility as foundational dimensions of tourist satisfaction and revisit intentions. The inclusion of Cultural Heritage (CH) also showed a positive impact, underscoring tourists’ interest in authentic and immersive cultural experiences, echoing the findings of Poria, Butler, and Airey (2003).

The overall explanatory power of the model—45% of the variance in Perceived Value and 65.3% in Tourist Satisfaction—demonstrates the effectiveness and reliability of the framework in capturing the multidimensionality of tourist experiences. Such high R² values are indicative of a well-fitting structural model, supporting its application for practical tourism planning and destination management (Hair et al., 2010; Kline, 2015).

6. Practical Implications

Based on the structural insights, several managerial recommendations can be proposed for tourism authorities and stakeholders in West Bengal, particularly in Darjeeling and other high-traffic destinations:

  • Enhance Transportation and Accessibility Infrastructure: Investments should focus on improving road quality, signage, and public transport facilities to ensure seamless tourist mobility and reduce travel-related stress (Singh, 2020).
  • Strengthen Safety Measures and Crisis Preparedness: Visible security presence, emergency services, and crowd control mechanisms at key sites can significantly improve safety perceptions and satisfaction levels (Reisinger & Mavondo, 2005).
  • Promote Cultural Festivals and Heritage Offerings: Initiatives to market and manage events such as Durga Puja, traditional music

    festivals, and guided heritage walks can enrich tourist experiences and differentiate West Bengal as a culturally immersive destination (Chatterjee & Bhattacharya, 2021).

These strategies are not only grounded in empirical results but also contribute to the sustainable development of tourism by balancing experience quality with responsible planning.

7. Conclusion

This study contributes to the expanding field of destination satisfaction modeling by proposing and validating a Structural Equation Model (SEM) that explains tourist satisfaction through five destination attributes—Destination Attractiveness, Infrastructure, Cultural Heritage, Safety, and Service Quality—and the mediating role of Perceived Value.

The model exhibited strong psychometric properties, including high construct reliability and fit indices, with all hypothesised paths found to be significant. These findings emphasise that tourist satisfaction is shaped both directly by destination characteristics and indirectly via perceived value, supporting the theoretical assumptions of means-end theory (Zeithaml, 1988) and experiential tourism frameworks (Gallarza et al., 2015).

From a policy perspective, the results provide a comprehensive diagnostic tool for identifying service gaps and experience enablers. By enhancing infrastructure, prioritising safety, and developing cultural programming, tourism managers in West Bengal can drive improvements in both perceived value and satisfaction, fostering positive word-of-mouth and repeat visitation.

Future research should consider longitudinal data and cross-cultural comparisons to expand the model's applicability. Inclusion of additional constructs such as tourist motivation, destination image, or expectation-performance gaps may further refine understanding of satisfaction dynamics in emerging destinations.

References

1. Akama, J. S., & Kieti, D. M. (2003). Measuring tourist satisfaction with Kenya’s wildlife safari: A case study of Tsavo West National Park. Tourism Management, 24(1), 73–81. https://doi.org/10.1016/S0261-5177(02)00044-4

2. Anderson, J. C., & Gerbing, D. W. (1988). Structural equation modeling in practice: A review and recommended two-step approach. Psychological Bulletin, 103(3), 411–423. https://doi.org/10.1037/0033-2909.103.3.411

3. Baker, D. A., & Crompton, J. L. (2000). Quality, satisfaction and behavioral intentions. Annals of Tourism Research, 27(3), 785–804. https://doi.org/10.1016/S0160-7383(99)00108-5

4. Bentler, P. M. (1990). Comparative fit indexes in structural models. Psychological Bulletin, 107(2), 238–246. https://doi.org/10.1037/0033-2909.107.2.238

5. Bhat, M. A., & Ghosh, S. (2022). Infrastructure, service quality, and tourist satisfaction: Evidence from India’s Eastern Himalayan region. Tourism Management Perspectives, 42, 100941. https://doi.org/10.1016/j.tmp.2022.100941

6. Bigné, J. E., Sánchez, I., & Andreu, L. (2009). The role of variety seeking in short and long run revisit intentions in holiday destinations. International Journal of Culture, Tourism and Hospitality Research, 3(2), 103–115. https://doi.org/10.1108/17506180910962113

7. Chatterjee, A., & Bhattacharya, S. (2021). Festival tourism and cultural consumption in Kolkata: A study on Durga Puja. Tourism Culture & Communication, 21(1), 35–50. [Publisher’s site link – DOI not assigned]

8. Chen, C.-F., & Chen, F.-S. (2010). Experience quality, perceived value, satisfaction, and behavioral intentions for heritage tourists. Tourism Management, 31(1), 29–35. https://doi.org/10.1016/j.tourman.2009.02.008

9. Chen, C.-F., & Tsai, D. (2007). How destination image and evaluative factors affect behavioural intentions? Tourism Management, 28(4), 1115–1122. https://doi.org/10.1016/j.tourman.2006.07.007

10. Chi, C. G.-Q., & Qu, H. (2008). Examining the structural relationships of destination image, tourist satisfaction and destination loyalty: An integrated approach. Tourism Management, 29(4), 624–636. https://doi.org/10.1016/j.tourman.2007.06.007

11. Crouch, G. I., & Ritchie, J. R. B. (1999). Tourism, competitiveness, and societal prosperity. Journal of Business Research, 44(3), 137–152. https://doi.org/10.1016/S0148-2963(97)00196-3


12. Dwyer, L., Forsyth, P., & Rao, P. (2000). The price competitiveness of travel and tourism: A comparison of 19 destinations. Tourism Management, 21(1), 9–22. https://doi.org/10.1016/S0261-5177(99)00081-3

13. Fornell, C., & Larcker, D. F. (1981). Evaluating structural equation models with unobservable variables and measurement error. Journal of Marketing Research, 18(1), 39–50. https://doi.org/10.2307/3151312

14. Fuchs, G., & Reichel, A. (2006). Tourist destination risk perception: The case of Israel. Journal of Hospitality & Leisure Marketing, 14(2), 83–108. https://doi.org/10.1300/J150v14n02_06

15. Gallarza, M. G., Arteaga, F., & Gil-Saura, I. (2015). Value dimensions in tourism: The value-satisfaction-loyalty chain. Tourism Management, 47, 60–70. https://doi.org/10.1016/j.tourman.2014.08.013

16. Hair, J. F., Black, W. C., Babin, B. J., & Anderson, R. E. (2010). Multivariate data analysis (7th ed.). Pearson Education.

17. Hu, L. T., & Bentler, P. M. (1999). Cutoff criteria for fit indexes in covariance structure analysis: Conventional criteria versus new alternatives. Structural Equation Modeling, 6(1), 1–55. https://doi.org/10.1080/10705519909540118

18. Hu, Y., & Ritchie, J. R. B. (1993). Measuring destination attractiveness: A contextual approach. Journal of Travel Research, 32(2), 25–34. https://doi.org/10.1177/004728759303200204

19. Kim, H., Lee, S., & Klenosky, D. B. (2003). The influence of push and pull factors on visitor satisfaction. Tourism Analysis, 8(2), 227–240.

20. Kline, R. B. (2015). Principles and practice of structural equation modeling (4th ed.). Guilford Press.

21. Kozak, M., & Rimmington, M. (2000). Tourist satisfaction with Mallorca, Spain, as an off-season holiday destination. Journal of Travel Research, 38(3), 260–269. https://doi.org/10.1177/004728750003800308

22. McKercher, B., & du Cros, H. (2002). Cultural tourism: The partnership between tourism and cultural heritage management. Haworth Press.

23. Oliver, R. L. (1997). Satisfaction: A behavioural perspective on the consumer. McGraw-Hill.

24. Parasuraman, A., Zeithaml, V. A., & Berry, L. L. (1988). SERVQUAL: A multiple-item scale for measuring consumer perceptions of service quality. Journal of Retailing, 64(1), 12–40.

25. Petrick, J. F. (2002). Development of a multi-dimensional scale for measuring the perceived value of a service. Journal of Leisure Research, 34(2), 119–134.

26. Poria, Y., Butler, R., & Airey, D. (2003). The core of heritage tourism. Annals of Tourism Research, 30(1), 238–254. https://doi.org/10.1016/S0160-7383(02)00064-6

27. Reisinger, Y., & Mavondo, F. (2005). Travel anxiety and intentions to travel internationally: Implications of travel risk perception. Journal of Travel Research, 43(3), 212–225. https://doi.org/10.1177/0047287504272017

28. Saunders, M., Lewis, P., & Thornhill, A. (2019). Research methods for business students (8th ed.). Pearson Education.

29. Saxena, G., & Ilbery, B. (2008). Integrated rural tourism: A border case study. Annals of Tourism Research, 35(1), 233–254. https://doi.org/10.1016/j.annals.2007.10.004

30. Singh, S. (2020). Tourism infrastructure and destination development: A case of Indian Himalayas. Tourism Planning & Development, 17(3), 225–243. https://doi.org/10.1080/21568316.2019.1631947

31. Sönmez, S. F., & Graefe, A. R. (1998a). Influence of terrorism risk on foreign tourism decisions. Annals of Tourism Research, 25(1), 112–144. https://doi.org/10.1016/S0160-7383(97)00072-8

32. Sönmez, S. F., & Graefe, A. R. (1998b). Determining future travel behaviour from past travel experience and perceptions of risk and safety. Journal of Travel Research, 37(2), 171–177. https://doi.org/10.1177/004728759803700209

33. Timothy, D. J., & Boyd, S. W. (2003). Heritage tourism. Pearson Education.

34. World Travel & Tourism Council. (2020). Travel & tourism: Economic impact 2020 – India. https://wttc.org


35. Yong, A. G., & Pearce, S. (2013). A beginner’s guide to factor analysis: Focusing on exploratory factor analysis. Tutorials in Quantitative Methods for Psychology, 9(2), 79–94. https://doi.org/10.20982/tqmp.09.2.p079

36. Yoon, Y., & Uysal, M. (2005). An examination of the effects of motivation and satisfaction on destination loyalty: A structural model. Tourism Management, 26(1), 45–56. https://doi.org/10.1016/j.tourman.2003.08.016

37. Zeithaml, V. A. (1988). Consumer perceptions of price, quality, and value: A means–end model and synthesis of evidence. Journal of Marketing, 52(3), 2–22. https://doi.org/10.2307/1251446

Disclaimer / Publisher's Note: The statements, opinions and data contained in all publications are solely those of the individual author(s) and contributor(s) and not of Journals and/or the editor(s). Journals and/or the editor(s) disclaim responsibility for any injury to people or property resulting from any ideas, methods, instructions or products referred to in the content.