E-ISSN:2583-1747

Research Article

Financial Performance

Management Journal for Advanced Research

2025 Volume 5 Number 4 August
Publisherwww.singhpublication.com

A Study on Financial Performance of Motilal Oswal Ltd.

Manjunath1, Sathvik S2*
DOI:10.5281/zenodo.17097646

1 Manjunath, MBA Student, Department of Management Studies, Ballari Institute of Technology and Management (Autonomous Institute under VTU-Belagavi), Jnana Gangothri Campus, Allipur, Hospet Road, Ballari, Karnataka, India.

2* Sathvik S, Associate Professor, Department of Management Studies, Ballari Institute of Technology and Management (Autonomous Institute under VTU-Belagavi), Jnana Gangothri Campus, Allipur, Hospet Road, Ballari, Karnataka, India.

Financial performance is a critical aspect of any organization, reflecting its ability to generate earnings and sustain itself over time. At its core, financial performance is a measure of how well an organization utilizes its resources to generate revenue, manage costs, and create value for its stakeholders. The theoretical background of financial performance is rooted in various financial theories and concepts, including the Efficient Market Hypothesis (EMH), Agency Theory, and Signaling Theory. These theories provide insights into how financial performance is influenced by factors such as market efficiency, agency costs, and information asymmetry. Financial performance refers to how well a company manages its assets, liabilities, and overall financial health to generate revenue and achieve profitability. It's a comprehensive evaluation of a company's financial standing, encompassing its ability to utilize resources, manage debts, and generate profits.
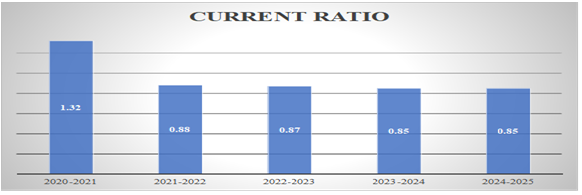
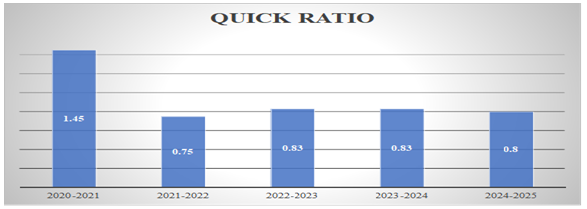
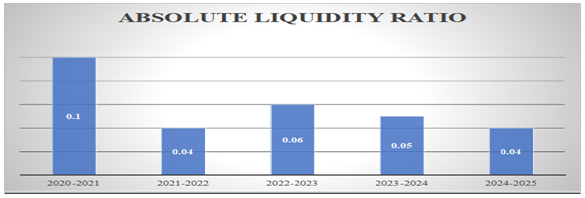
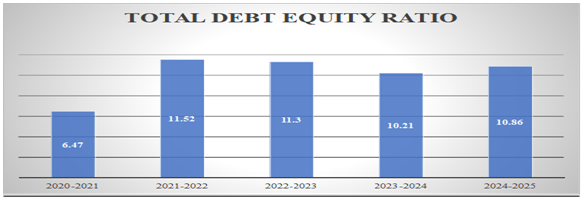
Objectives of the Study: The objectives of the present research is to analyze the financial performance of Motilal Oswal limited using key financial ratio, Examine the liquidity and solvency position of Motilal Oswal limited, To examine the impact of debt implications on shareholders networth and also to evaluate overall financial performance using dupont analysis.
Research Methodology: The Present study is based on secondary data.. To gather the relevant information, such as the net profit, total revenue, and working capital, the financial data from the companies five-year financial statements has been utilised. From the year 2020 to 2024 data and secondary data has been collected from research articles published in journals of repute, besides this authors have collected data from capital line database and authentic e-sources such as money control.com, ticker finology sources are utilised. Ratio analysis is the financial tool used to determine the key financial performance of Motilal Oswal Ltd.
Principal Findings of the study: Effective and efficient financial performance is critical to the survival and increased profitability of any firm. Analyzing financial performance is crucial for determining the company's profitability and potential risks. Company's long-term debt to shareholders' net worth ratio has increased significantly over the years. In 2020-2021, the ratio was 0.27, indicating that long term debt was approximately 27% of shareholders' net worth.

Keywords: financial performance, ratio analysis, financial statements, profitability, shareholders networth, debt-equity ratio

Corresponding Author How to Cite this Article To Browse
Sathvik S, Associate Professor, Department of Management Studies, Ballari Institute of Technology and Management (Autonomous Institute under VTU-Belagavi), Jnana Gangothri Campus, Allipur, Hospet Road, Ballari, Karnataka, India.
Email:
Manjunath, Sathvik S, A Study on Financial Performance of Motilal Oswal Ltd.. Manag J Adv Res. 2025;5(4):71-80.
Available From
https://mjar.singhpublication.com/index.php/ojs/article/view/245

Manuscript Received Review Round 1 Review Round 2 Review Round 3 Accepted
2025-07-14 2025-07-31 2025-08-19
Conflict of Interest Funding Ethical Approval Plagiarism X-checker Note
None Nil Yes 3.66

© 2025 by Manjunath, Sathvik S and Published by Singh Publication. This is an Open Access article licensed under a Creative Commons Attribution 4.0 International License https://creativecommons.org/licenses/by/4.0/ unported [CC BY 4.0].

Download PDFBack To Article1. Introduction2. Review of
Literature
3. Problematics4. Research
Methodology
5. Data Analysis
and Interpretation
6. Key Findings
of the Study
7. Suggestions8. ConclusionReferences

1. Introduction

Financial performance is a critical aspect of any organization, reflecting its ability to generate earnings and sustain itself over time. At its core, financial performance is a measure of how well an organization utilizes its resources to generate revenue, manage costs, and create value for its stakeholders. The theoretical background of financial performance is rooted in various financial theories and concepts, including the Efficient Market Hypothesis (EMH), Agency Theory, and Signaling Theory. These theories provide insights into how financial performance is influenced by factors such as market efficiency, agency costs, and information asymmetry. The Efficient Market Hypothesis suggests that financial markets are informationally efficient, meaning that prices reflect all available information. This theory implies that financial performance is influenced by market forces and that organizations cannot consistently achieve abnormal returns. Agency Theory highlights the importance of governance and control mechanisms in ensuring that managers act in the best interests of shareholders. This theory suggests that agency costs can arise when managers prioritize their own interests over those of shareholders, potentially impacting financial performance. Signaling Theory proposes that organizations can convey information about their financial performance and prospects through various signals, such as dividend payments or financial disclosures. These signals can influence investor perceptions and impact financial performance. Financial performance is also influenced by various financial ratios and metrics, such as return on equity (ROE), return on assets (ROA), and earnings per share (EPS). These metrics provide insights into an organization's profitability, efficiency, and growth prospects.

Financial performance refers to how well a company manages its assets, liabilities, and overall financial health to generate revenue and achieve profitability. It's a comprehensive evaluation of a company's financial standing, encompassing its ability to utilize resources, manage debts, and generate profits. Some of the key financial metrices which serve as tools to measure the financial performance of any company. which helps to determine the financial performance. Profitability refers to an organization's ability to generate earnings and profits from its operations.

Metrics such as net income, gross profit margin, and operating profit margin are used to evaluate profitability. Liquidity refers to an organization's ability to meet its short-term financial obligations. Metrics such as the current ratio, quick ratio, and cash ratio are used to evaluate liquidity. Efficiency refers to an organization's ability to utilize its resources effectively and minimize waste. Metrics such as asset turnover, inventory turnover, and accounts receivable turnover are used to evaluate efficiency. Solvency refers to an organization's ability to meet its long-term financial obligations. Metrics such as the debt-to-equity ratio and interest coverage ratio are used to evaluate solvency. ROI refers to the return generated by an investment or a project. Metrics such as ROI, return on assets (ROA), and return on equity (ROE) are used to evaluate the financial performance of investments and projects. Growth refers to an organization's ability to increase its revenue, earnings, and market share over time. Metrics such as revenue growth rate, earnings per share (EPS) growth rate, and return on equity (ROE) are used to evaluate growth.

2. Review of Literature

Muthu Prakash.S (2024) The goal of the research, "A Study on Financial Performance Analysis in Motilal," is to examine the company's financial status. This project aims to determine the company's efficiency using financial ratios such as the profitability and liquidity ratios, as well as the company's liquidity position, comparative analysis of the company's performance, and appropriate recommendations for enhancing the company's financial performance. The study focuses on the company's data over the previous five years. The examination of the ratios, comparisons, and common size studies is where the findings are found. Agnus Baby (2024) Achieving exceptional financial performance is a primary goal for every management team due to its importance in establishing a solid firm structure and facilitating growth. However, several factors consistently hinder the attainment of this objective, resulting in adverse effects on a firm’s success. Therefore, this study aims to analyze scholarly publications to understand relevant factors influencing the financial performance the manufacturing industry. Ghata H. Shah (2024) A thorough background investigation is usually necessary before beginning any research.


A thorough and in-depth research review is always a solid foundation for study. A researcher must always get familiar with the current study areas, techniques, and tools that have been employed by other researchers to conduct studies of a similar nature. Only then will the researcher be able to identify the gaps in the current body of study and determine what new information may be added. Tri Widyastuti (2024) The purpose of this research is to find out how much financial reporting contributes to company sustainability. The findings from this research are that financial reporting greatly influences company operations so that they can survive and develop. The research method uses a literature review study. Descriptive qualitative research methodology was used in this research. The data used in this research comes from previous research which is still relevant to the current investigation. Nilambari Moholkar (2024) The assessment of financial performance assumes essential value creation potential for the long-term sustainability of firms with specific references to capital-intensive and environmentally burdened sectors, such as the chemical industry. Traditional financial performance indicators like Return on Assets (ROA), Return on Equity (ROE), Earnings per Share (EPS), or Net Profit Margin (NPM), have been considered long metrics of measuring profitability and efficiency by corporations. Generally, these indicators fail to describe the visible economic value being delivered to shareholders since the cost of capital or the market expectation is excluded. Upik Djaniar (2024) This article provides a thorough assessment of the literature on the use of liquidity and profitability ratio techniques to analyze a company's financial performance. A company's entire health and sustainability may be determined by its financial performance, which also affects stakeholder trust and investment choices. Liquidity ratios, like the quick and current ratios, evaluate a company's capacity to pay short-term debts and offer valuable information about cash management and operational effectiveness. Sameer Pattiwar (2024) Financial Statement Analysis is a method of reviewing and analysing a company’s accounting reports in order to judge its past, present or projected future performance. Understanding and diagnosing the data in financial statements in order to assess the firm's profitability and financial soundness is the primary benefit of financial statement analysis, and to forecast the company's prospects for the future. The study made an effort to evaluate the financial statements and assess the

performance in terms of profitability and asset usage. Dang Thi Thuy (2023) An essential component in assessing the efficacy and success of a company's operations is its financial performance. It includes a range of metrics and indicators that evaluate the profitability, efficiency, liquidity, solvency, and general financial health of the business. Businesses, investors, and stakeholders must comprehend and evaluate financial performance as it offers information about the company's capacity to make money, manage resources, pay its debts, and provide value for shareholders. Thus, the main elements that affect a company's financial success are examined in this study. S. Pougajendy (2023) The process of going over and evaluating a company's accounting records in order to rank its past, current, and future performance is known as the financial statement. Our planning is focused on fulfilling specifications and accurately projecting future cash flow and profitability. This research analyzes Whirlpool Ltd.'s financial situation using secondary data, as well as the company's balance sheet, profile, and loss account over the previous five years. Liquidity, profitability, solvency, and activity ratios are among the instruments employed in this ratio analysis. Dilip Kumar Sharma (2023) The notion of financial performance and its analysis were further upon in the book. In order to gather data on financial performance, it also recorded pertinent stakeholders. Using previously published research, the review aimed to summarize the current level assessments. It also drew attention to inadequacies in the literature reviews. Two aspects of the body of literature were examined: businesses generally and by industry. K. Mahendran (2023) Financial analysis is the process of determining a company's advantages and disadvantages. The analysis is finished by figuring out how the items on the balance sheet relate to the business's profit and loss account. The five-year financial statements of HCL Technologies were examined as part of the examination. Determining the company's financial analysis and helping to evaluate its growth are the main objectives of the research. This study makes use of secondary data. The research included a number of variables, including basic profits per share, debt to equity, debt to asset, cash, dividend payout, quick, current, and asset turnover ratios. Sukenti Sukenti (2022) Literature article Reviewing the Effect of Liquidity and Profitability in the context of financial management,


a scientific study titled Financial Performance and Financial Distress tries to provide a research hypothesis on the interaction between factors. This literature review was written using the library research approach, including information from online academic databases like Google Scholar, and others. Nida (2022) A thorough review of techniques for the experts invested in capital markets is necessary to take the decision-making process on the stock. When it comes to profiting from the capital markets, timing is crucial. The accurate evaluation of the financial performance of the businesses in the tourism sector is of great importance both in socio-economic and strategic terms in all countries in the world. As a result, the majority of investors use multi-criteria decision-making techniques to choose the best stocks. Paresh Shantaram Khetal (2022) The process of evaluating businesses, initiatives, spending, and other financial-related activities to determine their suitability and performance is known as financial analysis. To ascertain if a business is stable, solvent, liquid, or competitive enough to justify a financial investment, financial analysis is typically employed. Establishing monetary policy, identifying investment projects or businesses, evaluating economic trends, and creating long term corporate activity plans are all accomplished through financial analysis. The financial figures and data synthesis are used to do this. Abdul Talib Bon (2021) Corporate financial performance is an overview of the company's financial status report over a period of time to figure out how successful and profitable a company is in producing revenue. These indicators include sales growth, profitability (reflected by ratios such as return on investment, return on sales and return on equity), share price, earnings per share, and so forth. The world economy is currently facing economic challenges as the coronavirus (COVID-19) presence has a serious impact on health care, economy, transportation, and other fields in regions. R.RANI (2021) This technical note provides a detailed explanation of how to analyze a company's financial accounts. It offers information on two popular financial tools: ratio analysis and analysis of typical size statements. This note's goal is to assist the reader in comprehending how to utilize these tools to evaluate a company's financial situation. The balance sheet and income statements from the Big Bazaar are examined in this note to illustrate the financial analysis process. In order to determine the company's comparable financial status, this research also compares the financial statements.

Lastly, to assess the patterns in the company's financial accounts, a trend analysis is also conducted. R Suresh (2020) Finance is the life blood of any business enterprise. Every business needs finance for smooth running of the firm. The present study is an attempt to make a financial performance analysis and changes in financial position of Super Auto Forge Private Limited as financial performance influence the liquidity and profitability. Financial statements overall position and also the operating results of the company. Thus, Financial Analysis aids to evaluate the financial health of a firm. K. Keerthi (2020) The main objective of this paper is to analyse the overall financial position of the bank using ratio analysis. It shows whether the firm is improving or worsening in past years. The secondary data is used for the entire study i.e. the last five years annual reports of KCCB. Ratio analysis provides a basis for both intra-firm as well as inter-firm comparisons. The pictorial representations are used for better understanding. Ratios are useful tool for various stakeholders like management, financiers, shareholders and creditors etc. Various types of ratios include liquidity ratios, profitability ratios, firm but also helps to identify the problems and offer suggestions to improve its performance. B. Saranya (2020) A company's finances are said to be its lifeblood. One of the fundamental pillars of all economic endeavors in the contemporary economy is finance.The main purpose of financial statements is to aid in decision-making. The company's ability, stability, and profitability are assessed by financial performance. Any firm that wants to operate smoothly needs financing, which is the lifeblood of any enterprise.To make the best use of this, it must generate money from the least expensive and riskiest source. Therefore, any business will want to know how its finances are doing. Bismark Maka (2018) The notion of financial performance and its analysis were expanded in the book. Additionally, it gathered information on financial performance from pertinent parties. Through previously published research, the review aimed to summarize the current level of knowledge about financial performance evaluations. Gaps in the reviewed literature were also brought to light. Two aspects of the body of current literature were examined: the financial performance of businesses generally, irrespective of industry or location, and those unique to Ghanaian businesses, namely those in the telecoms sector.


Nattarinee Kopecká, (2018) Performance measurement comprises several metrics and applications used as a benchmark in business sectors for both internal and external users. For managers, it expresses whether company’s targets are reached and as a way of evaluating risks and returns for shareholders. A variety of performance measures are utilized to almost every operational process, and the area is rather vast. Therefore, the aim of the study is to find out what kinds of financial tools are better linked to market value. The result of the study shows that financial measures appear to be favorable measures for companies providing relevant and meaningful information to shareholders.

3. Problematics

Motilal Oswal is a leading stock broker and financial services company, it is very critical aspect to determine the financial position of company. However, the company operates in a highly competitive and dynamic financial market, where various factors such as market volatility, regulatory changes, and changing investor preferences can impact its financial performance. Hence it is very important to investigate how Motilal Oswal's financial performance has been impacted by various internal and external factors, and what strategies the company has employed to maintain its financial stability and growth. understanding the company's financial health and stability in a rapidly changing financial landscape. As a leading financial services company, Motilal Oswal's financial performance is crucial to its overall success and sustainability.

4. Research Methodology

The Present study is based on secondary data. To gather the relevant information, such as the net profit, total revenue, and working capital, the financial data from the companies five-year financial statements has been utilised. From the year 2020 to 2024 data and secondary data has been collected from research articles published in journals of repute, besides this authors have collected data from capital line database and authentic e-sources such as money control.com, ticker finology sources are utilised. Ratio analysis is the financial tool used to determine the key financial performance of Motilal Oswal Ltd.

5. Data Analysis and Interpretation

Table 1: Represents the Current Ratio
Current Ratio = Current Assets/ Current Liabilities

YEARCURRENT ASSETSCURRENT LIABILITIESCURRENT RATIO
2020-2021321643832224254948331.32
2021-2022359032428740746166720.88
2022-2023345824902639897995770.87
2023-2024337713765139290607920.85
2024-2025326304991338314581420.85
AVERAGE RATIO0.954

mjar_245_01.PNG

Interpretation: The current ratio was highest in the year of 2020-2021 From the above data, it is observed that the current ratio of the company has been declining over the years, from 1.32 in 2020-2021 to 0.85 in 2024-2025. This decline in the current ratio indicates a weakening of the company's short-term liquidity position.

Table 2: Represents the Quick Ratio
Quick Ratio = Quick Assets/ Current Liabilities

YEARQUICK ASSETSCURRENT LIABILITIESQUICK RATIO
2020-2021352142989024254948331.45
2021-2022311971385240746166720.75
2022-2023332567019439897995770.83
2023-2024327910375239290607920.83
2024-2025308916149038314581420.80
AVERAGE RATIO0.932

mjar_245_02.PNG

Interpretation: The company's quick ratio was highest in the year of 2020-2021 is 1.45 The company's quick ratio indicates a mixed liquidity position over the years.


Initially, the quick ratio was strong at 1.45 in 2020-2021, but it declined significantly to 0.75 in 2021-2022, indicating a liquidity strain. Although the ratio improved slightly in the subsequent years, it remained below 1, suggesting that the company's quick assets were not sufficient to cover its current liabilities.

Table 3: Demonstrates the Absolute Liquidity Ratio of Motilal Oswal Ltd.
Absolute Liquidity Ratio = Absolute Liquid Assets/ Current Liabilities

YEARABSOLUTE LIQUIDITY ASSETCURRENT LIABILITIESABSOLUTE LIQUIDITY RATIO
2020-2021248332789.3124254948330.10
2021-2022194963394.540746166720.04
2022-202326788405539897995770.06
2023-202421682930539290607920.05
2024-2025179062534.138314581420.04
AVERAGE RATIO0.058

mjar_245_03.PNG

Interpretation: Above chart demonstrates The company's absolute liquidity ratio was highest in the year of 2020-2021 is 0.10 the absolute liquidity ratio was 0.10, meaning that the company's absolute liquid assets covered only 10% of its current liabilities. The ratio further declined to 0.04 in 2021-2022 and 2024-2025, indicating a very weak liquidity position.

Table 4: Exhibit showing Debt Equity Ratio of Motilal Oswal Ltd.
Debt Equity Ratio = Total Debt / Equity

YEARTOTAL DEBTEQUITYTOTAL DEBT EQUITY RATIO
2020-202142113286506500000006.47
2021-20224462991934.6738734841111.52
2022-20234378090865.41387264437.111.30
2023-20244318582954.6938849531110.21
2024-20254221000305.25388515311.110.86
AVERAGE RATIO10

mjar_245_04.PNG

Interpretation: The company's debt-to-equity ratio was highest in the year of 2021-2022 is 11.52, In 2020-2021 the debt-to-equity ratio was 6.47, which is already high. However, the ratio increased further to 11.52 in 2021-2022, indicating a significant increase in debt levels. Although the ratio decreased slightly in the subsequent years, it remained high, ranging from 10.21 to 11.30.

Table 5: Demonstrates the Proprietary Ratio of Motilal Oswal Ltd.
Proprietary Ratio = Shareholders Fund/ Total Assets

YEARSHAREHOLDERS FUNDTOTAL ASSETPROPRIETARY RATIO
2020-202165000000042113286500.15
2021-20223873484114462991934.670.086
2022-2023387264437.14378090865.410.089
2023-20243884953114318582954.690.089
2024-2025388515311.14221000305.250.092
AVERAGE RATIO0.10

mjar_245_05.PNG

Interpretation: The company's proprietary ratio was highest in the year of 2021-2022 is 0.15, 2020-2021, the proprietary ratio was 0.15, which is already low. However, the ratio declined further to 0.086 in 2021-2022, indicating a decrease in the company's equity base relative to its assets.


Table 6: Showing the Long term debt to Shareholders Networth Ratio of Motilal Oswal Ltd.

YEARLONG TERM DEBTSHEREHOLDERS FUNDLONG TERM DEBT TO SHAREHOLDE RS NET WORTH RATIO
2020-202117858338176500000000.27
2021-2022388375262.73873484111
2022-2023388291288.8387264437.11
2023-2024389522162.73884953111
2024-2025389542162.7388515311.11
AVERAG
E RATIO
0.854

Interpretation: The company's long-term debt to shareholders' net worth ratio was highest in the year of 2021-2022 to 2024-2025 was same 1, is 0.15 company's long-term debt to shareholders' net worth ratio has increased significantly over the years. In 2020-2021, the ratio was 0.27, indicating that long-term debt was approximately 27% of shareholders' net worth.

Table 7: Represents the Fixed Assets Ratio of Motilal Oswal Ltd.
Fixed Asset Ratio = Fixed Asset/ Capital Employed

YEARFIXED ASSETCAPITAL EMPLOYEDFIXED ASSET RATIO
2020-202171698266.5317858338170.04
2021-202280231449.9388375262.70.20
2022-202386857590.7388291288.40.22
2023-2024111311550.2389522132.70.28
2024-2025132323958389542163.30.33
AVERAGE
RATIO
0.21

mjar_245_07.PNG

Interpretation: The company's fixed asset ratio to shareholders' net worth ratio was highest in the year of 2024-2025 is 0.33, 2020-2021, the fixed asset ratio was 0.04, indicating that fixed assets were a relatively small portion of capital employed. However, the ratio increased significantly to 0.20 in 2021-2022 and continued to rise to 0.33 in 2024-2025.

Table 8: Demonstrates the Fixed Assets to Net Worth Ratio of Motilal Oswal Ltd.
Fixed Asset to Networth Ratio = Fixed Assets/ Shareholders Funds

YEARFIXED ASSETSHAREHOLDERS FUNDFIXED ASSET TO NET WORTH RATIO
2020-202171698266.536500000000.11
2021-202280231449.93873484110.20
2022-202386857590.7387264437.10.22
2023-2024111311550.23884953110.29
2024-2025132323958388515311.10.34
AVERAGE
RATIO
0.23

mjar_245_08.PNG

Interpretation: The company's fixed asset ratio net worth ratio was highest in the year of 2024-2025 is 0.34 that 2020-2021, the ratio was 0.11, indicating that fixed assets were relatively small compared to shareholders' funds. However, the ratio increased to 0.20 in 2021-2022 and continued to rise to 0.34 in 2024-2025.

Table 9: Demonstrates the Inventory Turnover Ratio of Motilal Oswal Ltd.
Inventory Turnover Ratio = Cost of Goods Sold/ Average Inventory

YEARCOST OF GOODS SOLDAVERAGE INVENTORYINVENTORY TURNOVER RATIO
2020-2021528726379.5218887736.92.41
2021-2022508509161.1324505518.51.57
2022-2023949150283.21907083224.98
2023-20241114383652105355424.410.57
2024-20251139249366130066478.98.76
AVERAGE
RATIO
5.65

mjar_245_09.PNG

Interpretation: The company's Inventory Turnover ratio was highest in the year of 2023-2024 is 10.57. The Inventory Turnover ratio decreased to 1.57 in 2021-2022, suggesting a decline in inventory management efficiency.


However, the ratio increased significantly to 4.98 in 2022-2023 and further to 10.57 in 2023-2024, indicating a substantial improvement in inventory management efficiency.

Table 10: Represents the Fixed Assets Turnover Ratio of Motilal Oswal Ltd.
Fixed Assets Turnover Ratio = Net Sales/ Fixed Assets

YEARNET SALESFIXED ASSETFIXED ASSET TURNOVER RATIO
2020-2021587730794.2471698266.538.19
2021-2022691093873.3980231449.98.61
2022-20231108582669.0286857590.712.8
2023-20241255089422.88111311550.211.27
2024-20251257203998.001323239589.50
AVERAGE
RATIO
10

mjar_245_10.PNG

Interpretation: The company's fixed asset turnover ratio was highest in the year of 2022-2023 is 12.8, fixed asset turnover ratio increased from 8.19 in 2020-2021 to 12.8 in 2022-2023, indicating an improvement in the company's ability to generate sales from its fixed assets. However, the ratio decreased to 9.50 in 2024-2025.

6. Key Findings of the Study

  • Current ratio of the company has been declining over the years, from 1.32 in 20202021 to 0.85 in 2024-2025. This decline in the current ratio indicates a weakens the company's short-term liquidity position.
  • Quick ratio indicates a mixed liquidity position over the years. Initially, the quick ratio was strong at 1.45 in 2020-2021, but it declined significantly to 0.75 in 20212022, indicating a liquidity strain. Although the ratio improved slightly in the subsequent years, it remained below 1, suggesting that the company's quick assets were not sufficient to cover its current liabilities.

  • In 2020-2021 the absolute liquidity ratio was 0.10, meaning that the company's absolute liquid assets covered only 10% of its current liabilities. The ratio further declined to 0.04 in 2021-2022 and 2024-2025, indicating a very weak liquidity position.
  • In 2020-2021, the debt-to-equity ratio was 6.47, which is already high. However, the ratio increased further to 11.52 in 2021-2022, indicating a significant increase in debt levels. Although the ratio decreased slightly in the subsequent years, it remained high, ranging from 10.21 to 11.30.
  • 2020-2021, the proprietary ratio was 0.15, which is already low. However, the ratio declined further to 0.086 in 2021-2022, indicating a decrease in the company's equity base relative to its assets.
  • Company's long-term debt to shareholders' net worth ratio has increased significantly over the years. In 2020-2021, the ratio was 0.27, indicating that long term debt was approximately 27% of shareholders' net worth.
  • 2020-2021, the fixed asset ratio was 0.04, indicates that fixed assets were a relatively small portion of capital employed. However, the ratio increased significantly to 0.20 in 2021-2022 and continued to rise to 0.33 in 2024-2025.
  • 2020-2021, the ratio was 0.11, indicates that fixed assets were relatively small compared to shareholders' funds. However, the ratio increased to 0.20 in 20212022 and continued to rise to 0.34 in 2024-2025.
  • Inventory Turnover ratio decreased to 1.57 in 2021-2022, suggesting a decline in inventory management efficiency. However, the ratio increased significantly to 4.98 in 2022-2023 and further to 10.57 in 2023-2024, indicating a substantial improvement in inventory management efficiency.
  • Fixed asset turnover ratio increased from 8.19 in 2020-2021 to 12.8 in 2022-2023, indicates an improvement in the company's ability to generate sales from its fixed assets. However, the ratio decreased to 9.50 in 2024-2025.

7. Suggestions

  • Firm can Improve its accounts receivable and payable management to free up cash.
  • It is suggested to minimise the inventory levels to improve liquidity position of company.
  • Motilal Oswal Ltd has to consider the short-term financing options or debt restructuring.
  • Company has to concentrate on debt repayment or restructuring to reduce debt levels.
  • Motilal Oswal Ltd has an equity financing options to increase shareholders' funds.
  • In order to improve the profitability of firm heavy reliance on debt may affect financial position of the company Further, Motilal Oswal Ltd has an option to generate internal funds through retained or plough back earnings.

8. Conclusion

The company's financial performance is a mixed bag. While it has shown improvement in inventory management efficiency and fixed asset utilization, its liquidity position and debt-to-equity ratio are causes for concern. The company needs to focus on improving its liquidity position, reducing its debt levels, and increasing its equity base to ensure long-term sustainability. - Improve liquidity position by managing working capital more efficiently. Reduce debt levels and focus on equity financing. Continue to improve inventory management efficiency. Monitor fixed asset utilization and optimize asset allocation. The company's liquidity position has weakened over the years, with a decline in the current ratio and absolute liquidity ratio. The quick ratio indicates a mixed liquidity position, but it remains below 1, suggesting that the company's quick assets are not sufficient to cover its current liabilities. The company's debt-to-equity ratio is high, indicating a significant reliance on debt financing. The proprietary ratio is low, indicating a decrease in the company's equity base relative to its assets.

References

1. Baby, A., Mia, M.A., & Pitchay, A.A. (2024). A systematic review of financial performance in the manufacturing industry. Futur Bus J, 10, 70.

2. Muthu Prakash.S. (2024). A study on financial performance analysis in Motilal. International Journal of Research Publication and Reviews, 5(4).

3. Ghata H. Shah. (2024). An examination of financial performance: A review study. EPRA International Journal of Multidisciplinary Research, 10(8).

4. Widyastuti, T. (2024). Trusted financial statements: A literature review. Siber Journal of Advanced Multidisciplinary, 2(1).

5. Moholkar, N., & Choudhari, A. (2024). A study of literature review on financial performance of selected & listed chemical companies with reference to EVA and MVA ShodhKosh: Journal of Visual and Performing Arts, 5(1).

6. Upik Djaniar. (2024). Financial performance analysis of companies through liquidity and profitability ratio approaches. Journal of Economic, Business and Accounting, 7(5).

7. Sameer Pattiwar. (2024). A financial statement analysis of LTIMINDTREE: A comprehensive review of “company’s financial performance”. International Journal of Research Publication and Reviews, 5(10).

8. Dang Thi Thuy. (2023). Literature review on factors affecting financial performance of firms. International Journal of Business and Management Invention, 12(6).

9. S. Pougajendy. (2023). A study on financial performance analysis of Whirlpool Pvt. Ltd – Puducherry. IJCRT, 11(4).

10. Dr. Dilip Kumar Sharma. (2023). Analysis of corporate financial performance: A review. International Journal of Advanced Research in Science, Communication and Technology, 3(1).

11. K. Mahendran. (2023). A study on financial performance analysis of HCL Technologies Limited. IJCRT, 11(5).

12. Sukenti. (2022). Literature review of financial performance and financial distress: Liquidity and profitability analysis. Dinasti International Journal of Digital Business Management, 3(6).

13. Nida. (2022). Financial performance evaluation by multi-criteria decision-making techniques. Heliyon, 8(5).


14. Khetal, P., & Sardar, H. C. (2022). A study on the analysis of financial performance with reference to PTL Enterprises Ltd. Research Review International Journal of Multidisciplinary, 7(2).

15. Abdul Talib Bon. (2021). A review of corporate financial performance literature: A mini-review approach. Proceedings of the 11th Annual International Conference on Industrial Engineering and Operations Management.

16. R. Rani. (2021). A study on financial performance using ratio analysis. IJMRR, 11(3).

17. R Suresh. (2020). A study on financial performance analysis with reference to Super Auto Forge Pvt Ltd. Ilkogretim Online, 19(3).

18. K. Keerthi. (2020). A study on financial performance using ratio analysis of Kumbakonam Central Co-operative Bank. ICTACT Journal on Management Studies, 6(3).

19. B. Saranya. (2020). A study on financial performance analysis with special reference to Glidersoft Technologies at Chennai.

20. Bismark Maka. (2018). Review of financial performance analysis of corporate organizations.

21. N. Suresh. (2018). Review of financial performance analysis of corporate organizations. Asian Journal of Management, 9(1).

22. https://www.capitaline.com/

23. https://www.motilaloswal.com/

24. https://www.moneycontrol.com/

25. https://ticker.finology.in/

Disclaimer / Publisher's Note: The statements, opinions and data contained in all publications are solely those of the individual author(s) and contributor(s) and not of Journals and/or the editor(s). Journals and/or the editor(s) disclaim responsibility for any injury to people or property resulting from any ideas, methods, instructions or products referred to in the content.