E-ISSN:2583-1747

Research Article

Automobile Industry

Management Journal for Advanced Research

2025 Volume 5 Number 3 June
Publisherwww.singhpublication.com

Trends in Liquidity Position of Indian Automobile Companies: A Study of Companies Listed in NIFTY Auto

Samal M1*, Thongdok DJ2, Aich S3, Dutta A4, Sharma S5
DOI:10.5281/zenodo.15828711

1* Monalisha Samal, Student (B.Com 4th Semester), Department of Commerce, School of Business, Adamas University, Barasat, India.

2 Dechen Jangmu Thongdok, Student (B.Com 4th Semester), Department of Commerce, School of Business, Adamas University, Barasat, India.

3 Sneha Aich, Student (B.Com 4th Semester), Department of Commerce, School of Business, Adamas University, Barasat, India.

4 Abhijeet Dutta, Student (B.Com 4th Semester), Department of Commerce, School of Business, Adamas University, Barasat, India.

5 Suraj Sharma, Assistant Professor, Department of Commerce, School of Business, Adamas University, Barasat, India.

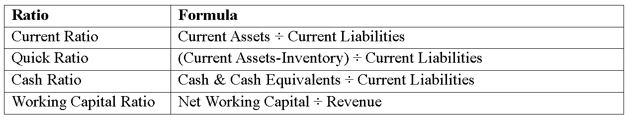
Liquidity is defined as a company's ability to meet its short-term obligations. It is one of the important criteria for measuring the financial health of the company. Understanding the liquidity position is crucial for making informed investment decisions over the long term, as dividend decisions often depend on liquidity. Understanding and analysing liquidity position is a challenging task. Therefore, as a solution, the present study aims towards the Indian automobile industry and evaluates the liquidity position by using short-term liquidity ratios and working capital management ratios.
A study was performed in the companies listed in the NIFTY Auto index. An attempt has been made to rank the companies from the select list. Users can use this methodology to rank the companies in their portfolio. The study finds the top three and bottom three companies based on liquidity ranking and suggests some practices to enhance liquidity among the automobile companies.

Keywords: automobile industry, economic growth, financial performance, liquidity, sustainability

Corresponding Author How to Cite this Article To Browse
Monalisha Samal, Student (B.Com 4th Semester), Department of Commerce, School of Business, Adamas University, Barasat, India.
Email:
Samal M, Thongdok DJ, Aich S, Dutta A, Sharma S, Trends in Liquidity Position of Indian Automobile Companies: A Study of Companies Listed in NIFTY Auto. Manag J Adv Res. 2025;5(3):24-31.
Available From
https://mjar.singhpublication.com/index.php/ojs/article/view/222

Manuscript Received Review Round 1 Review Round 2 Review Round 3 Accepted
2025-05-08 2025-05-24 2025-06-16
Conflict of Interest Funding Ethical Approval Plagiarism X-checker Note
None Nil Yes 2.38

© 2025 by Samal M, Thongdok DJ, Aich S, Dutta A, Sharma S and Published by Singh Publication. This is an Open Access article licensed under a Creative Commons Attribution 4.0 International License https://creativecommons.org/licenses/by/4.0/ unported [CC BY 4.0].

Download PDFBack To Article1. Introduction2. Literature
Review
3. Research
Gap
4. Research
Methodology
5. Analysis
and Discussion
6. ConclusionReferences

1. Introduction

Liquidity is the ability of the firm to meet its short-term liabilities with either cash or cash equivalents (quickly convertible) assets. Liquidity is critical both to ensure uninterrupted operations as well as to avoid financial distress. The automobile companies, particularly in India, have a dual responsibility in managing liquidity: not only is liquidity critical in day-to-day operations but it is also critical for adapting to larger demands such as transitioning to electric vehicles and transforming their business for sustainable solutions.

1.1 Objectives of the Study

This paper considers the liquidity position of major automobile companies in India and focuses on their economic performances over the past few years. Our assessment of liquidity ratios enables us to determine liquidity position and offer valuable insights on the prevailing developments, strengths, weaknesses and challenges to improve liquidity management practices in India’s automobile sector which will make it a more robust and resilient sector.

1.2 Significance of the study

The liquidity position of companies is a crucial indicator of financial health, particularly in capital-intensive sectors like the automobile industry. In India, the automobile sector is a key economic pillar, contributing significantly to GDP, employment, and technological progress. However, the sector’s liquidity management has grown increasingly complex due to multiple external and internal challenges, including cyclical demand patterns, regulatory developments, rising production costs, and global disruptions.

1.3 Layout of the study

The present study is divided into seven sections – the first section is the introduction which states the objective and significance of the study, the second section reviews the existing literature on liquidity or other profitability analysis, the third section presents the research gap. The fourth section of the study discusses research methodology while the data analysis is conducted in the fifth section. The sixth section discusses the findings, and the seventh section concludes the study.

2. Literature Review

Anand and Singh (2018) have analyzed the role of working capital management in maintaining liquidity and ensured operational continuity in the automobile sector. Their study also revealed that optimal liquidity levels help companies avoid financial distress and promote smooth flow of operations. Rao and Reddy (2019) emphasized that liquidity ration work as effective tools for predicting financial stability in fluctuating markets. Sinha and Gupta (2020) did a profitability analysis of the Indian Automobile Industry, noted that firms with higher profitability ratios are better considered to reinvest in innovation and meet market demands. Patel and Mehta (2020) analyzed the financial data over ten years of some of the major companies in the automobile sector, revealed that while some companies excel others may need to improve to stay competitive. Chaudhary (2018) accentuated the role of macroeconomic factors which include GDP growth, disposable incomes, and urbanization in developing the industry.

Singh and Kumar (2020) talked about the technological advancements in the industry, especially in the areas regarding automation EV and AI technology which are giving a new structure to the future of the automobile industry. Gupta and Tiwari (2018) pointed out that well organized inventory management and cost control are key factors for improvement in profitability in firms like Maruti Suzuki and Tata Motors. The car market in India has become tougher as foreign companies like Toyota and Hyundai compete strongly with local brands, especially in the mid-range segment.

3. Research Gap

The literature survey done on liquidity and profitability analysis found a lack of extensive trend study on liquidity analysis. The present study shall fulfill the gap by doing a graphical analysis to understand the trends in liquidity ratio of Indian automobile industry

4. Research Methodology

4.1 Data

Liquidity Ratios of top ten Automobile Companies were compared to determining their Liquidity positions.


Data collection was done by going through the financial reports of these companies over a period of five years, from 2020 to 2024, which enables us to conclude information that shows long-term trends. Table 1 shows the companies under the study.

4.2 Financial Metrics

In the present study, four financial metrices to address liquidity position were used. They are the current ratio, quick ratio, cash ratio and working capital ratio. Table 2 shows the key liquidity ratios used in the present study.

Table 1: Companies analyzed under the study

Sl. No.Company Name
1Apollo Tyres Ltd.
2Ashok Leyland Ltd.
3Bajaj Auto Ltd.
4Hero MotoCorp Ltd.
5Mahindra & Mahindra Ltd.
6Maruti Suzuki India Ltd.
7MRF Ltd.
8Samvardhana Motherson International Ltd.
9Tata Motors Ltd.
10TVS Motor Company Ltd.

Source: NIFTY Auto

Table 2: Liquidity ratios used in the study

mjar_222_Table01.JPG
Source:
Researcher’s compilation

4.2.1 Current Ratio

The current ratio measures the company’s ability to meet its short-term liabilities using its short-term assets. The ratio of current assets to current liabilities is regarded as the current ratio. A higher current ratio, i.e., above unity, is considered healthy for financial performance.

4.2.2 Quick Ratio

The quick ratio or acid-test ratio measures the ability of paying off near short term obligations using its most liquid assets. It is a more stringent measure for measuring liquidity. It is used to measure very short-term liquidity for a company. High quick ratios indicate better liquidity, while lower cash indicate poor liquidity.

4.2.3 Cash Ratio

The cash ratio is used to measure the firm’s ability to meet its short term-liabilities using cash and cash equivalents. A higher cash ratio indicates high liquidity, whereas a lower cash ratio indicates less liquidity.

4.2.4 Working Capital Ratio

The working capital to revenue ratio indicates the ability of the company to meet its current assets and liabilities relative to its revenue. It helps in liquidity assessment and assessing operational efficiency of the companies. A moderate ratio indicates a flexible and efficient resource allocation.

4.3 Research Method

The line chart was used to understand the trend in the liquidity ratios selected under study for the past five years, i.e., 2020-2024. The average ratio was denoted by a straight line, and the companies which were above the average score and same which were below the average score were identified. Thereafter, rank analysis was done based on the ratios, to see which company was ranked top among all the liquidity ratio, to determine the top liquid companies and less liquid companies in the Indian automobile sector.

5. Analysis and Discussion

5.1 Analysis of Current Ratio (2020-24)

Figure 1 shows the trend of current ratios for the top ten automobile companies for the year 2020 to 2024. 2020: From the graph, five companies are performing above the value of Average Current Ratio (CR) (i.e., 0.82), while rest of companies below the value of CR (i.e., 0.82). 2021: From the graph, five companies are performing above the value of CR (i.e., 0.96), while rest of companies below the value of CR (i.e., 0.96). 2022: From the graph, four companies exceed above the value of CR (i.e., 0.97), while six companies are performing below the value of CR (i.e., 0.97). 2023: From the graph, only one company i.e., Mahindra & Mahindra Ltd. has a value of 12.96 which is above the value of CR (i.e., 1.99), while remaining companies fall below the value of CR (i.e., 1.99). 2024: From the graph, four companies are performing above the value of CR (i.e., 0.79), while six companies are performing below the value of CR (i.e., 0.79).


5.2 Analysis of Quick Ratio (2020-24)

Figure 2 shows the trend of Average Quick Ratio (QR) for the top ten automobile companies for the year 2020 to 2024. 2020: From the graph, five companies are performing above the value of QR (i.e., 0.82), while rest of companies below the value of QR (i.e., 0.82). 2021: From the graph, five companies are performing above the value of QR (i.e., 0.96), while rest of companies below the value of QR (i.e., 0.96). 2022: From the graph, four companies exceed above the value of QR (i.e., 0.97), while six companies are performing below the value of QR (i.e., 0.97). 2023: From the graph, only one company i.e., Mahindra & Mahindra Ltd. has a value of 12.96 which is above the value of QR (i.e., 1.99), while remaining companies fall below the value of QR (i.e., 1.99). 2024: From the graph, four companies are performing above the value of QR (i.e., 0.79), while six companies are performing below the value of QR (i.e., 0.79).

5.3 Analysis of Cash Ratio (2020-24)

Figure 3 shows the trend of cash ratios for the top ten automobile companies for the year 2020 to 2024. 2020: From the graph, four companies are performing above the value of Average Cash Ratio (i.e., 0.11), while remaining six companies. 2021: From the graph, five companies exceed above the value of Average Cash Ratio (i.e., 0.07), while other five companies fall below the Average Cash Ratio (i.e., 0.07). 2022: From the graph, four companies are performing well because they are above the value of Average Cash Ratio (i.e., 0.08), while six companies fall below Average Cash Ratio (i.e., 0.08). 2023: From the graph, seven companies are performing above the value of Average Cash Ratio (i.e., 0.04), while rest three companies are performing below the value of Average Cash Ratio (i.e., 0.04). 2024: From the graph, four companies are performing above the value of Average Cash Ratio (i.e., 0.08), while rest six are performing below Average line (i.e., 0.08).

5.4 Analysis of Working Capital Ratio (2020-24)

Figure 4 shows the trend of working capital ratios for the top ten automobile companies for the year 2020 to 2024. 2020: From the graph, five companies are performing above the value of Working Capital Ratio (i.e., -0.05), while rest five are performing below the average line. 2021: From the graph, six companies are performing above the

value of Working Capital Ratio (i.e., 0.0), while rest four are performing below the average line. 2022: From the graph, five companies are performing above the value of Working Capital Ratio (i.e., 0.1), while rest five are performing below the average line. 2023: From the graph, six companies are performing above the value of Average Working Ratio (i.e., 0.0), while rest four are performing below the average line. 2024: From the graph, six companies are performing above the value of Average Working Ratio (i.e., 0.0), while rest four companies are performing below the average line.

5.5 Trends in Liquidity Ratio of Indian Automobile Industry

Figure 5 shows the overall trend in liquidity ratios of Indian automobile sector for the period 2020 to 2024, mainly focusing on average current ratio, quick ratio, cash ratio and working capital ratio. Each ratio reflects the automobile industry’s ability to meet its short term obligations.

The average current ratio shows a declining trend over these years (~1.15 in 2020 to ~1.09 in 2024), indicating weakening of liquidity ratios. A similar trend was observed for quick ratio (~0.80 in 2020 to ~0.70 in 2024). The average cash ratio remained stagnant with more or less eual to ~0.09 across years, which indicated lower reliance on cash reserves. On the other hand, the average working capital ratio exhibits a sharp dip from ~0.68 in 2022 to ~0.65 in 2023, and recovery in 2024 by increasing to ~0.67.

The trends in liquidity highlighted consistent liquidity challenges, emphasizing the need for enhanced financial management strategies to ensure stability across the sector.

5.6 Identification of Top Liquid Automobile Companies

The table 3 demarcates the topmost liquid automobile companies by ranking ten companies based on their performance in four major liquidity ratios—current ratio, quick ratio, cash ratio, and working capital ratio—along with calculating their overall average liquidity ranking. Bajaj Auto holds the top spot with an average ranking of 2.5, showcasing superior performance in both the current and quick ratios (1st), indicating high short-term financial strength. Hero MotoCorp holds the 2nd spot with an average ranking of 3.5, securing


1st position in the working capital ratio and 2nd position in the quick ratio, thus indicating good liquidity management.

M&M and Samvardhana are jointly in the 3rd position with an average ranking of 3.75. While M&M is consistent in performance on all parameters, Samvardhana is best on the cash ratio. MRF is at the 5th position, which shows moderate liquidity.

Conversely, TVS Motor, Maruti, and Tata Motors have the worst liquidity ranks, and Tata Motors has the last rank persistently, identifying serious financial issues and the necessity of better liquidity planning.

The study reveals significant disparities in the liquidity management practices of the top ten Indian automobile companies between 2020 and 2024. Bajaj Auto and Hero MotoCorp emerged as the most liquid companies, consistently outperforming their peers in key liquidity ratios, including the current ratio, quick ratio, and working capital ratio. Bajaj Auto’s strong performance highlights its ability to efficiently manage short-term liabilities, while Hero MotoCorp demonstrates robust working capital management. M&M and Samvardhana ranked moderately, with M&M showing balanced performance and Samvardhana excelling in cash liquidity.

On the other hand, Tata Motors and TVS Motors displayed persistent weaknesses in liquidity management, ranking lowest across multiple ratios. The industry averages for liquidity ratios, particularly cash and current ratios, fluctuated, reflecting external financial pressures and varying cash management strategies. Overall, the findings underscore the need for targeted improvements, particularly among underperforming companies, to achieve greater financial stability and competitiveness.

Figure 1: Current ratio of top ten Indian automobile companies (2020-24)

mjar_222_01(a).JPG

mjar_222_01(b).JPG

mjar_222_01(c).JPG

mjar_222_01(d).JPG

mjar_222_01(e).JPG

Source: Researcher’s Computation

Figure 2: Quick ratio of top ten Indian automobile companies (2020-24)

mjar_222_02(a).JPG

mjar_222_02(b).JPG


mjar_222_02(c).JPG

mjar_222_02(d).JPG

mjar_222_02(e).JPG

Source: Researcher’s Computation

Figure 3: Cash ratio of top ten Indian automobile companies (2020-24)

mjar_222_03(a).JPG

mjar_222_03(b).JPG

mjar_222_03(c).JPG

mjar_222_03(d).JPG

mjar_222_03(e).JPG

Source: Researcher’s Computation

Figure 4: Working capital ratio of top ten Indian automobile companies (2020-24)

mjar_222_04(a).JPG

mjar_222_04(b).JPG

mjar_222_04(c).JPG

mjar_222_04(d).JPG


mjar_222_04(e).JPG

Source: Researcher’s Computation

Figure 5: Trends in liquidity position of top ten Indian automobile companies

mjar_222_05(a).JPG

mjar_222_05(b).JPG

mjar_222_05(c).JPG

mjar_222_05(d).JPG

Source: Researcher’s Computation

Table 3: Liquidity position of Indian automobile companies

Sl.Company NameCurrent Ratio RankQuick Ratio RankCash Ratio RankWorking Capital Ratio RankAverage Liquidity Rank
1Bajaj11622.5
2Hero22913.5
3M&M43533.75
5Samvardhana54153.75
7MRF35845
4Ashok76275.5
6Apollo68766.75
10TVS Motor99397.5
9Maruti871088.25
8Tata Motor10104108.5

Source: Researcher’s Computation

6. Conclusion

The study concludes that liquidity management varies significantly among Indian automobile companies. While Bajaj Auto and Hero MotoCorp demonstrate financial resilience through strong liquidity positions, companies like Tata Motors and TVS Motors struggle with inadequate cash reserves and inefficient working capital management.

The observed disparities demonstrate the inconsistent use of the financial strategies in the sector. Weak firms need to improve their cash reserves, manage their inventories better and have better receivables turnover to improve liquidity. To help liquidity, they can use advanced cash forecasting and analytical techniques to enable better liquidity monitoring. Additionally, exploring strategic partnerships and better operational integration can help them manage their financial stress when market conditions fluctuate.


Regulators and industry leaders should encourage financial literacy and industry best practices for liquidity which can make the sector more stable in the long run. All these factors, plus improved financial governance and transparency will improve investors’ confidence and sustain competitiveness in the ever-changing automobile sector.

6.1 Limitations of the Study

The research is constrained to financial data from 2020-2024, which will not catch all long-term trends in liquidity management. The research is also limited to some selected Indian Automobile companies, thereby limiting statistically additional generalization across the industry. It should also be noted that this analysis did not explicitly consider external macroeconomics factors such as inflation, interest rates, and other recent policy changes that will impact liquidity. Further, the study largely relied on the secondary data from financials, which can have reporting bias, as well as accounting inconsistencies. Such variations could heavily sway the financial ratios for the companies, potentially affecting the quality of research outcomes.

6.2 Scope for Future Study

Later investigations can extend the timeframe for analysis beyond 2024, enabling examination of liquidity trends over a longer duration within the automobile sector. Expanding the range of financial indicators to consider cash flows and the structure of debt could provide more clarity on liquidity management. In addition, an exploration of macroeconomic drivers affecting financial performance could deliver greater insights into liquidity considerations faced by industry-wide performers. A comparative study of Indian versus global automobile companies may provide management insights into best practice approaches or strategies of liquidity management. Also, understanding of the liquidity performance of the industry could be further extended by capturing qualitative perspectives such as management strategies, corporate governance, and operational functionality,

References

1. Anand, A., & Singh, R. (2018). Liquidity Management in Indian Automobile Companies. Journal of Financial studies, 25(4), 102-114.

2. Chaudhary, R., & R. (2018). The impact of macroeconomic factors on the development of the Indian automobile Industry. International Journal of Economics Studies, 36(3), 210-225.

3. Gupta, M., & Tiwari, P. (2018). Inventory management and cost control: A case study of Maruti Suzuki and Tata Motors. Journal of Business and Economics, 29(2), 150-170.

4. Patel, R., & Mehta, V. (2020). Financial Performance Indicators in the Indian Automobile Sector. Journal of Economic Studies, 45(3), 200-215.

5. Rao, T., & Reddy, V. (2019). The predictive power of liquidity ratios in fluctuating markets: A study of the Indian automobile sector. Financial Analyst Journal, 33(1), 97-109.

6. Singh, A., & Kumar, R. (2020). Technological advancements in the automobile industry. Automation, electric vehicles, and AI technology. Journal of Technology and Business, 12(5), 55-72.

7. Sinha, S., & Gupta, R. (2020). Profitability and Investment Capacity in the Indian Automobile Industry. Journal of Economics and Finance, 43(1), 103-115.

Disclaimer / Publisher's Note: The statements, opinions and data contained in all publications are solely those of the individual author(s) and contributor(s) and not of Journals and/or the editor(s). Journals and/or the editor(s) disclaim responsibility for any injury to people or property resulting from any ideas, methods, instructions or products referred to in the content.