E-ISSN:2583-1747

Research Article

Economic Growth

Management Journal for Advanced Research

2025 Volume 5 Number 2 April
Publisherwww.singhpublication.com

Reforms and Economic Transformation in India: A Stocktaking

Sunita Singh1, Manish Kumar2*
DOI:10.5281/zenodo.15302383

1 Sunita Singh, Research Scholar, University Department of Economics, Jai Prakash University, Chapra, Bihar, India.

2* Manish Kumar, Assistant Professor, Department of Economics, Yadunandan College, Dighwara, Saran (A Constituent Unit of Jai Prakash University), Chapra, Bihar, India.

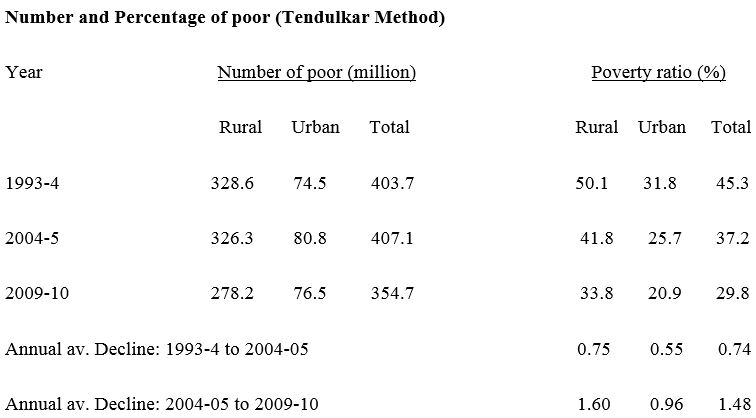
In early 1991, a major economic crisis occurred in India due to worsening balance of payments situation. To tackle the problem the country introduced a policy of macroeconomic stabilization and structural reforms. The widening gap between the public revenue and public expenditure resulted in growing fiscal deficit which was financed by borrowings. The internal imbalance in the fiscal situation and the external imbalance in the payments situation wee closely related. A widening current account deficit and fiscal deficit precipitated the crisis. To counter the worsening economic situation India launched a programme of economic reforms that principally had two components: Structural reforms and Macroeconomic stabilization. In the last three decades or so the Indian economy has flourished by registering sustained economic growth. There is improved fiscal management and the external payments situation has substantially got better. The economy is much bigger in size and the per capital income an indicator of rising living standard has risen substantially. India currently is the fifth largest economy in the world. Rising economic growth has been accompanied by sharp decline in poverty, expansion of trade, industry and services and rural transformation.

Keywords: development, macroeconomic crisis, economic reforms, globalization, economic growth, poverty reduction, industry and services, agriculture

Corresponding Author How to Cite this Article To Browse
Manish Kumar, Assistant Professor, Department of Economics, Yadunandan College, Dighwara, Saran (A Constituent Unit of Jai Prakash University), Chapra, Bihar, India.
Email:
Sunita Singh, Manish Kumar, Reforms and Economic Transformation in India: A Stocktaking. Manag J Adv Res. 2025;5(2):15-22.
Available From
https://mjar.singhpublication.com/index.php/ojs/article/view/203

Manuscript Received Review Round 1 Review Round 2 Review Round 3 Accepted
2025-03-02 2025-03-22 2025-04-14
Conflict of Interest Funding Ethical Approval Plagiarism X-checker Note
None Nil Yes 2.65

© 2025 by Sunita Singh, Manish Kumar and Published by Singh Publication. This is an Open Access article licensed under a Creative Commons Attribution 4.0 International License https://creativecommons.org/licenses/by/4.0/ unported [CC BY 4.0].

Download PDFBack To Article1. Introduction2. Economic Reforms3. Economic Growth4. Poverty Reduction5. Agriculture, Farm
Income and Rural
Transformation
6. Industry and
Services
7. Globalization and
Economic Change
in India
8. ConclusionReferences

1. Introduction

Modern market economies are mixed economies where both the government and the market play a critical role in allocation of resources and in achieving distributive justice. Economic planning, industrial policies and the Five-Year Plans formed the cornerstone of development under a dirigiste policy regime prior to the introduction of economic reforms in 1991. After four decades of planning the market-oriented reforms were introduced in 1991 when the country faced a balance of payments crisis. Not everyone agreed with the need to launch reforms as it was seen as a surrender to corporate interests and the international institutions. The reforms introduced many liberalizing initiatives and moved the economy towards greater privatization and globalization. India was a latecomer to economic reforms.

The need for a policy shift had become evident much earlier, as many countries in East Asia achieved high growth and poverty reduction through policies which emphasized greater export orientation and encouragement of the private sector. India took some steps in this direction in the 1980s, but it was not until 1991 that the government signaled a systemic shift to a more open economy with greater reliance upon market forces, a larger role for the private sector including foreign investment, and a restructuring of the role of government. Macroeconomic stability was the center- piece of the structural adjustment effort in 1991. Over a period of time through the 1950s, 1960s, and 1970s the economy had become over controlled and rigid; consequently, entrepreneurship was heavily constrained. The import substituting inward looking development strategy that could have been relevant in the 1950s and 1960s was no longer suitable in the modern globalizing world. Hence overall reform had to be undertaken to lay down a new framework to achieve growth with justice. The introduction of economic reforms did not mean the end of planning rather its orientation changed from the state driven strategy to a market-oriented development process. Since the early 1990s the planning process became indicative in nature with the state assuming upon itself the important responsibility of delivering welfare to the poor. The economic scenario in India has changed dramatically since the early 1990s. (Panagariya, 2008)

2. Economic Reforms

The macroeconomic crisis had three aspects:

a. Fiscal imbalance
b. Fragile Balance of Payments situation
c. Inflationary pressures

The crisis made economic reforms necessary. It emphasized on demand and supply side measures-

A. Macroeconomic management – Demand Management
a. Control of Inflation
b. Fiscal adjustment
c. Balance of Payment adjustment

B. Structural Reforms – Supply-side Management
a. Industrial Deregulation
b. Trade and Capital flows reforms
c. Financial sector reforms
d. Public sector reforms and Disinvestment

3. Economic Growth

During the first half of the 20th century there was a near stagnation in per-capita income while the growth in national income was minimal. There was steady growth of per-capita income and that of the GDP in the second half of the twentieth century after India gained independence from the British rule. The Five-Year Plans initiated a process of development that marshalled the resources to generate growth and employment. During the period 1950-1980 the growth rate in GDP was roughly 3.5 percent per annum while growth in per-capita income was 1.4 percent per annum. The implementation of economic reforms that liberalized the economic space and allowed greater integration with the global economy accelerated the growth momentum (Nayyar, 2019)

The first three years of the 1990s, the GDP grew 4% annually. In the following four years, the growth rate jumped to 7.1% but only to fall back to 5.2% in the succeeding five years. Underlying these fluctuations, the trend growth rate was approximately 6%. In the late 1980s, the long-run growth rate had shifted up to 5.5% from its prior level of approximately 3.5%. Growth rate in the three years (2003-04 to 2005-06) showed signs of yet another break in the trend rate. After three years of reform, GDP growth accelerat­ed to 7.5 percent per year from 1994–95 to 1996–97.


Then growth slowed down because of the Asian financial crisis (1997–99), two major droughts (2000 and 2002), and the recession of 2001. But after 2003 growth picked up sharp­ly and averaged almost 9.5 percent for three years from 2005–06 through 2007–08. This was unprecedented growth achievement.( Bhagwati and Panagariya, 2013)

This was accompanied by a massive surge in government welfare spending, thanks to the revenue generated by high growth. The Great Recession (2007–09) pulled growth down, but it was a still impressive 6.8 percent in the trough of 2008–09, followed by rapid recovery to 8.0 percent and 8.5 percent in the next two years. The Indian economy produced some spectacular successes in those three years not seen before — successes that rival the performance of the Chinese economy. In turn, these successes fundamentally altered the initial conditions with important longer-term implications. (Hope et al., 2013)

One important reason why this growth represented something very real was the near spectacular expansion of India’s trade with the rest of the world. There is often a contestation about the notion of structural break in the economy. The sharp step-up in growth rates not just in the aggregate but also in the various sectors in the economy suggests that the structural break occurred in the early 1980s. Having sustained 6% annual growth since the 1990s, India is now regarded as an unequivocal economic success. This has not only directly raised incomes and employment but yielded a revenue bonanza that has financed huge increases in social spending, anti-poverty programs and infrastructure. As a result of the slowdown induced by the global financial crisis in 2008-09, the Indian economy responded quickly to monetary and fiscal stimulus and achieved a growth rate of 8.6 percent and 9.3 percent in 2009-10 and 2010-11. The compound annual growth rate (CAGR) for GDP at factor cost, over the decade ending 2012-13 is 7.9 percent (Bhagwati and Panagariya, 2013)

The Eleventh Five Year Plan (2007-08 to 2011-12) had aimed at achieving faster and more inclusive growth. Rapid GDP growth, targeted at 9.0 per cent per annum, was regarded necessary for two reasons: first, to generate the income and employment opportunities that were needed for improving living standards for the bulk of the population;

and second, to generate the resources needed for financing social sector programmes, aimed at reducing poverty and enabling inclusiveness. The economy has performed well on the growth front, averaging 8.2 per cent in the first four years. The economy slowed down in 2012-2014 period due to fiscal mismanagement, inflationary pressures on the economy, inappropriate capital account management and uncompetitive exchange rate and slowdown in infrastructure development. India’s per-capita GDP was around $1500 and a GDP of around $2 trillion by 2015. The pandemic saw a significant deceleration in India’s GDP. However, since FY22 the economy has been in recovery mode registering around a 6 percent growth rate. Since 2014-15 the economy did perform well consequent upon the measures taken by the government however the pandemic slowed down India’s growth expectations.

Table 1: Aggregate and Sectoral Growth Rates since Independence

PeriodGDPAgriculture, Forestry
& Fishing
IndustryManufacturingServices
1951-52 to 1965-19663.861.996.426.254.59
1965-66 to 1981-19823.662.284.264.114.11
1981-82 to 1988-895.533.755.916.086.39
1988-89 to 2006-076.183.456.847.07.41
2006-07 to 2014-156.633.266.637.737.58
2014-15 to 2022-235.693.745.476.026.22

Source: Arvind Panagariya, India: The Emerging Giant (2008) and author calculations based on data from National Statistical Office, Ministry of Statistics and Programme Implementation, GoI

4. Poverty Reduction

India has remained committed to reducing poverty ever since it became independent in 1947. The First Five Year Plan clearly stated that that removing income disparities was among the highest priority areas for democratic planning. Due to slow growth in the pre-reform days the progress on this front was rather limited.


YearPoverty
Ratio Rural
Poverty
Ratio Urban
Combined All India
Poverty Ratio
1973-7456.449.054.9
1977-7853.145.251.3
198345.740.844.5
1987-8839.138.238.9
I993-9437.332.436.0

Source: Planning Commission

However, the biggest achievement of the reforms to date remains the sharp reduction in poverty. The proportion of those living below the poverty line has come down. This is in sharp contrast to pre-reform days of autarky, license raj and state ownership when the rate of reduction of poverty was slow. Ever since Independence, the goal of our policy had been to eliminate poverty but little success was achieved until liberalization helped push up the growth rate, generated massive revenues for welfare programmes and brought a relatively faster reduction in poverty. The planning commission estimates poverty using data from the large sample surveys on household consumer expenditure carried out by National Sample Survey Organization (NSSO) every five years. It defines poverty line on the basis of monthly per capita consumption expenditure (MPCE). Economic growth has no meaning without substantial poverty reduction. According to previous official poverty estimates, the per centage of the population living below the poverty line had declined by 8.5 per centage points between 1993-04 and 2004-05. Since the appropriateness of the poverty line was questioned in some quarters, the Government appointed an Expert Committee under the Chairmanship of the late Prof. Suresh Tendulkar. The methodology followed currently is based on the recommendation of the Expert group headed by Professor Suresh Tendulkar which submitted its report in 2009. It computed the poverty lines at an all India level as MPCE of Rs 447 for rural areas and Rs 579 for urban areas in 2004-05. The Planning Commission has updated the poverty lines and poverty ratios for the year 2009-10 as per the recommendations of the Tendulkar committee using NSS 66th round (2009-10) data from Household Consumer Expenditure Surveys. It estimated the poverty lines at the all India level as MPCE of Rs 673 for rural areas and Rs 860 for urban areas in 2009-10. Based on these cut-offs the percentage of people living the poverty line has declined from 37.2 percent in 2004-05 to 29.8 percent in 2009-10.

The estimates using the latest NSS survey for 2009-10 suggested that the per centage of the population in poverty declined, at a faster pace than before, by approximately one per centage point per annum, during the five-year period 2004-05 to 2009-10. Since 2009-10 was a drought year, and poverty in that year could have increased temporarily, the underlying rate of decline is probably more than one per centage point per year. The planning Commission updated poverty line estimates on the recommendation of Professor Tendulkar. On the basis of the Household Consumer Expenditure Survey 2011-12 data of the NSS 68th round the incidence of poverty declined from 37.2 percent in 2004-05 to 21.9 percent 2011-12. The rural poverty ratio declined from 41.8 percent in 2004-05 to 25.7 percent in 2011-12. The urban poverty ratio declined from 25.7 percent in 2004-05 to 13.7 percent in 2011-12. The rural poverty ratio continues to remain higher than urban poverty ratio suggesting that farm incomes need to grow faster to catch up the urban income levels. It is important to highlight that faster economic growth rates have resulted in accelerated poverty reduction in the post-reform period however we still have a large number of poor people in India. (Dev, 2016)

3.JPG

Source: Planning Commission Press Release 2013

5. Agriculture, Farm Income and Rural Transformation

Agriculture is the mainstay of the Indian economy because of its high share in employment and livelihood creation notwithstanding its reduced contribution to the nation’s GDP. The share of agriculture in India’s GDP declined from 35 percent in 1990-91 to 15 percent in 2022-23 due to rapid growth in India’s services and the industrial sector. The decline is brought out not by the decline in the agricultural GVA but rapid expansion in the industrial and services GVA.


In growth terms, agriculture and allied sectors has registered an annual average growth of around 4 percent in the last few years. Growth in allied sectors including livestock, dairying and fisheries has been the major drivers of overall growth in the sector. Agriculture is central to the nutritional needs of the country and also remains the largest sector of Indian economy as a source of employment. In 2014-15, 45.7 percent of the workforce was employed in agriculture. The agriculture and allied sectors grew at a positive growth rate of 3.9 percent during 2021-22. The timely intervention in the form of Atma Nirbhar Bharat coupled with other growth promoting schemes have further helped agriculture to achieve an improved growth of 3.9 percent in 2021-22. The farm sector grew at an average rate of around 3.2 per cent during the first four years of the Eleventh Plan and the average farm sector growth in the Eleventh Plan period was around 3.0 per cent. This is a marked improvement from the average growth of about 2.0 per cent during the Tenth Plan period. Still, with half of our population dependent on agriculture and allied activities, we needed faster farm sector growth to benefit poor farmers, many of whom are women. It has been suggested that one percentage point growth in agriculture is at least two to three times more effective in reducing poverty than the same magnitude of growth emanating from non-agriculture sector. Since agriculture is a State subject, the Centre has to work hand in hand with the States to bring coherence in policies and strategies. There was deceleration in agricultural sector in the Ninth plan and it continued in the Tenth plan. This necessitated to take corrective steps to reverse the slowdown and attain the desired 4 percent growth target. The food grain production touched a new peak of 241 million tons in 2010-11 and growth in agriculture in the Eleventh Plan was around an average 3.3 per cent per year as compared to 2.2 per cent in the Tenth Plan. The rural incomes have increased and rural poverty has reduced over the years, however the the gap between urban and rural incomes has widened quite sharply because agriculture has grown slower than other sectors and because employment growth in non-agriculture has not been enough to sufficiently reduce the population dependent on agriculture. It is important to recognize that in India aound 45 percent of the population still relies on farm sector for livelihood opportunities.

The real income of an average farmer rose moderately at the rate of 3.4 percent per annum from 2002-03 to 2018-19. This is not bad, but clearly not good enough. Farmer’s income has been low compared to non-agriculture segment which has been growing above 5 percent per annum (NSO, MoSPI). In 2002-03, the average income of an average farming household was recorded at 2115/- (equivalent to 7160/- in 2021-22 prices). By 2018-19, it had risen to 10218/- (SAS, MoSPI, various years). Farmers income growth in this period closely followed annual agricultural GDP growth rates that increased by about 3.1 percent. However, if one looks at the CAGR of agricultural GDP, it reached 4.7 percent annually between 2015-16 and 2022-23. It is important to understand the institutional context in which agriculture has developed in India. Prior to the Green Revolution our productivity was low. Public and private investment has ensured the improvement in agricultural productivity however it is still below the international standards. In advanced economies of the world far fewer hands produce more per-capita than India. In India the farm size is too small and fragmented holdings restrict the potential output. The farm sector has shown improvements in the reform-phase however it can still do better. (Gulati, 2024)

6. Industry and Services

The actual operation of the Industrial policy (particularly the Industrial licensing policy) was a subject of great debate and discussion prior to the 1990s. The main points of criticism of earlier policies was that it had led to the inadequate development of the industrial sector in the economy. The main points of criticism were regarding:

a. Licensing and underutilization of capacity
b. Discretionary power of Licensing authorities
c. Licensing and concentration of economic power
d. Licensing and regional imbalance
e. Delays in processing of applications

In line with the liberalization measures, the government announced a new Industrial Policy in 1991. The policy deregulated the industrial economy in a substantial manner. It took a series of initiatives with respect to the following areas:

a. Industrial Licensing
b. Public Sector Policy
c. MRTP Act
d. Foreign Investment and Technology


e. Liberalization of Industrial location Policy
f. Abolition of Phased Manufacturing Programme
g. Removal of Mandatory Convertibility Clause

The major reforms of policies accelerated the GDP growth above 7 percent and the industry sector growth to above 9 percent in mid-1990s. India’s organized manufacturing sector experienced a sharp acceleration in output and employment growth during the early years of economic reforms, from 1991-92 to 2001-02. The fast growth recorded by manufacturing during the first half of the 1990s was led by sharp revival in private-sector investment. Capital and skill intensive industries such as metals, machinery, automobiles and chemicals recorded extremely fast rates of growth. With the onset of the 2008 crisis manufacturing slowed due to depressed demand. During 2001-02 to 2010-11, industrial growth to 7.8 percent per annum, services growth to above 9.4 percent and GDP growth to 7.9 percent per annum. Per capital GDP growth accelerated appreciably by 2.5 percentage point to 6.2 percent. The five-year period 2003-04 to 2007-08 was remarkable for witnessing an annual average growth rate of 8.7 percent in GDP and 10.3 percent in industry. However, as a consequence of economic crisis in the developed world the industrial sector faced a slowdown but recovered in the following years. The recently released new series of national accounts, revising base year from 2004-05 to 2011-12 gives a better record of industrial sector. This is mainly due to much better performance in the mining and manufacturing sectors as per the new series. In 2020-21, the share of manufacturing fell to 14.4 percent whereas electricity, gas and water supply recorded positive growth. The Index of Industrial Production (IIP) provides data for 23 sub-groups of the manufacturing sector. In the period April-November 2021-22, all the 23 sectors recorded a positive growth. The MSME sector has emerged as a highly vibrant and dynamic sector of the economy. While the contribution of the MSMME sector to the overall GVA rose from 29.3 percent in FY2018 to 30.5 percent in FY2020, the economic impact of the pandemic caused the sector’s share to fall to 26.8 percent in FY2021. MSME contribution to the manufacturing sector’s GVA also marginally fell to 36.0 percent in FY 2021 (ASI, 2023)

The MSME sector play an important role in the economy:

a. To generate large-scale employment
b. To sustain economic growth and increase exports
c. To make the growth inclusive

The service sector has played an important role in enabling improved economic performance during the post-reform period. Services have been the fastest growing sector in the economy. The services sector contributed hugely in the 1990s and the 2000s. The sector’s compound annual growth rate (CAGR) has consistently risen over the decades, from 6.2 percent during the 1980s to 7.3 percent during the 1990s and further to 8.7 percent during the 2001-16 period, exceeding overall GDP growth throughout. The high growth of the sector has contributed to the sector’s rising share in the overall economy. Between 1980 to 2016, agriculture share in GDP declined by nearly 30 percent which was mainly offset by an increase of 23 percent in the share of services. In 2016, the services along with construction contributed around 60 percent of the economy.

7. Globalization and Economic Change in India

From an economic point of view, globalization is the integration of the national economy with the international economy. There are few important ways in which this integration takes place:

i. Trade in goods and services
ii. Movement of capital across countries in search of profits
iii. Flow of people across national territories for economic opportunities
iv. Technology transfer

Of the four channels, the trade in goods and services and the flow of international capital constitute the main integrating forces. The real thrust to globalization was provided by the new economic policy introduced by the government of India. Prior to this India remained largely closed to international trade and flow of capital. The size of the external sector of the economy was rather small due to limited international economic interaction. The policies in place did not encourage the international exchange of goods and services and the flow of capital. We followed a rather restrictive economic policy regime. As a result, the trade to GDP ratio was small before 1991. However, the launch of economic reforms changed the economic scenario on this front (Bhagwati, 1993).


The period after 1980-81 was marked by balance of payments difficulties. The second oil shock pushed up the import bill substantially while exports lagged considerably behind. This led to the widening of the trade deficit. During the seventh plan private remittances also slowed down. As a result, the net invisibles could finance only 24 percent of the trade deficit in the seventh plan. The problem was compounded by the Gulf war in 1990-91. The problem got worsened due to India’s increased reliance on costly external commercial borrowings. With the downgrading of India by credit rating agencies consequent upon the large deficit in India’s balance of payments situation and the political uncertainties at home investors’ confidence in the Indian economy was shaken and there was substantial capital flight. Default on debt servicing seemed imminent and it could be avoided only from international multilateral agencies like the International Monetary Fund (IMF). The financial assistance was made available by these institutions but on their terms and conditions. These terms included the adoption of structural reforms and stabilization policies. (Ahluwalia, 2012)

i. Exchange rate adjustment and rupee convertibility: An important measure to integrate with the world economy is to make the currency convertible and allow the exchange rate to be determined by the market forces. In subsequent years the government has moved progressively towards this goal and removed various restrictive measures

ii. Import Liberalization: India followed an inward-oriented trade strategy until the late 1980s; there were severe exchange and import controls that restricted the entry of foreign goods however after 1991 policies were liberalized the Indian market was opened up for foreign trade

iii. Opening up to foreign capital: In a bid to attract foreign capital the government liberalized the erstwhile restrictive controls on foreign capital

Over time, the trade openness of countries across the globe has increased which is reflected in the increasing trade to GDP ratio. In India the share of trade to GDP ratio has been steadily increasing reaching 46 percent in 2021. International trade has been an important pillar of India’s of India’s growth story. It has brought resilience to the economy contributing both in the GDP and also in employment generation.

India’s imports have increased so has its exports to the world markets. India’s trade to GDP ratio was in the range of 10-15 percent in the 1980s. India’s trade policy in the pre-reform days heavily restricted the expansion of the extremal trade economy. India followed a strategy of import substitution. Quantitative restrictions were imposed to limit the flow of imports in the economy. As a result, India’s participation in the world market declined steadily in the second-half of the 20th century. It has been improving since the launch of trade reforms in 1990s. India’s export share in world trade increased perceptively during the 1990s. It increased from 0.5 percent in mid 1990s to 0.6 percent around the millennium. India’s merchandised exports increased from around $100 billion prior to 2005-06 to $300 billion in 2011-12. India’s share of world goods exports rose from 0.5 percent in 1992 to 1.7 percent in 2017. India’s merchandise exports as percent of GDP stood at 12.1 in 2018-19. India’s manufactured exports share in total merchandise exports stood at 72.8 percent in 2018. FDI flows in India have been gaining momentum since 1991. In particular, FDI flows reached a high of $64 billion in 2020. (Panagariya, 2024)

8. Conclusion

The launch of economic reforms has accelerated the growth rate of the economy and sharply reduced poverty. Since 1991, the fiscal capacity of the state to launch welfare schemes has been rising which is evident from the budgetary allocations made each year on various sectors like health, education, rural development etc. A growing market economy offers growth opportunities however those who are unskilled or less-skilled and poor have to be provided state support and brought in the mainstream of the economy. The sustained growth momentum has been marked by a consistent rise in the per capita income indicating a rise in the standard of living. Compared to the pre-reform period the economic performance has been better on many counts. The centrality of the growth in the development process is well established. Without sustained growth poverty reduction is likely to slow down. Hence, in light of the needs of the weakest members in the society the reforms must be implemented to further reduce those susrving on the margins of the society and bring prosperity to all.


Agriculture and the farm sector continue to support a bulk of the population despite the contribution to the GDP falling down. Globalization has opened up new opportunities and the country has benefitted from increased trade and investment. The adoption of economic reforms has lifted the growth potential of the economy. The higher growth rates have lifted many out of poverty and deprivation. That is the good news. The bad news is that inequality is rising and job creation has not kept pace with the needs of a burgeoning labour force. This is an area of concern. To sum up, economic reforms have produced beneficial outcomes but to further catch up with advanced economies, there is still a lot of pending reforms and work that requires action.

References

1. Ahluwalia, I. J. et. al. (2012). India’s economic reforms and development: Essays for Manmohan Singh. New Delhi: Oxford University Press.

2. MoSPI. (2023). Annual survey of industries, 2022-23.

3. Bhagwati, Jagdish N. (1993). India in transition: Freeing the economy. New York: Clarendon Press.

4. Bhagwati, Jagdish N., & Arvind Panagariya. (2013). Reforms and economic transformation in India. New Delhi: Oxford University Press.

5. Dev, S Mahendra. (2016). Economic reforms, poverty and inequality. IGIDR.

6. Gulati, Ashok, Ranjana Roy, Ritika Juneja, & Manish K Prasad. (2024). A new deal for agriculture. EPW, 59(15).

7. Hope, Nicholas, Anjini Kochhar, Roger Noll, & T N Srinivasan. (2013). Economic reforms in India: Challenges, prospects and lessons. Cambridge University Press.

8. Nayyar, Deepak. (2019). Resurgent Asia: Diversity in development. New Delhi: Oxford University Press.

9. Panagariya, Arvind. (2008). India: The emerging giant. Oxford University Press.

10. Panagariya, Arvind. (2024). India’s trade policy: The 1990s and beyond. New Delhi: Harper Collins.

11. Planning Commission: Eleventh Five Year Plan, 2007-2012.

12. Planning Commission: Twelfth Five Year Plan, 2012-2017.

Disclaimer / Publisher's Note: The statements, opinions and data contained in all publications are solely those of the individual author(s) and contributor(s) and not of Journals and/or the editor(s). Journals and/or the editor(s) disclaim responsibility for any injury to people or property resulting from any ideas, methods, instructions or products referred to in the content.